Fall 2010 Advanced Mechanics PHYS 5103


Fall 2010 Advanced Mechanics PHYS 5103

Before beginning a book on mechanics it should be noted that classical mechanics has become out of date. For centuries, following work by Galileo and Newton, mechanics was physics and no classical descriptor was needed. Then along came the quantum revolution of the early 20th century. After that there arose the need to distinguish classical mechanics from quantum mechanics.
Classical mechanics may be out of date but it is not yet obsolete and it is doubtful that it ever will be for things that go, “Bang!” Our first examples, involving banging cars and balls, are easy classical problems but very difficult quantum problems. A detailed 20th century quantum mechanical solution at even 1 Joule of energy would require impossible 1040 byte computers. Classical mechanics, on the other hand, permits solution by classical Greek computers, that is, a ruler and compass. Quantum mechanics may be more fundamental and elementary but that does not mean it is easier. Far from it!
Our approach to classical mechanics combines Euclidian geometry and Newtonian calculus in ways that Newton did in the Principia. However, 21st century computer graphics is better for exposing hidden power of geometry than tediously engraved 18th century figures. Modern graphics clarify logical steps while the limitations of old fashioned printing tend to obscure them and led to the impression that the logic of algebra and calculus always trumps that of geometry. Such myths are difficult to debunk.
Use of geometry, both Euclidian and Riemannian, is a distinguishing feature of this book. Two centuries of mechanics books include few that clearly show analytic geometry as a powerful tool for gaining derivations, solutions, and most important, understanding of mechanics. Some little known lectures by Richard Feynman are among the few that have begun to revive this ancient art.
Most of the geometric constructions in this book were first discovered with help of computer animations and simulations, and that is another feature of this book that is an increasingly useful tool for any serious student of physics. Modern classical theory courses should have a lab for both thought experiments and, if possible, real experiments that show the geometry of mechanics.
Most of physics is understood by analogies that reflect underlying connections between seemingly disparate objects or phenomena. Mechanical analogies or analogs have been sources of understanding since the Hellenic period and are a large part of the development in this book. Analogies are often based on a shared mathematical description like a differential equation or symmetry algebra that reflects an underlying shared geometry. It is such connections that we treasure and develop in what follows. We shall particularly emphasize those mechanical analogies that shed light on the relation of classical and quantum mechanics. Without this it is doubtful we can claim an understanding of either.
About the Programs: LearnIt and CodeIt
The first tier of computer programs in this book is the LearnIt series consisting of BounceIt, OscillIt, QuantIt, WaveIt, etc. listed in the table below. These are (hopefully) user-friendly applications that made many of the figures in this book and provide animated visualizations of physical phenomena or analogies thereof. They are analog computers that make text figures become thought experiments.
The suffix “It” attached to most of these programs is derived from the FaceIt interface invented by Dan Kampemier, founder of FaceWare in Urbana, IL, one of the first worldwide programming projects. I participated in FaceWare from 1985 until 1993 and am now involved in its re-application in Apple Computer’s X-Code. One advantage of FaceWare or X-Code is its graphical user/programmer interface (GUI or GPI) that can be easily updated with new menus, dials, text editors, spreadsheets, movie or graphics windows.
Another advantage for academic application is that good GPI’s keep resource code separate. This avoids time wasted reinventing the wheel or debugging buttons in class. Now teaching useful root-level object oriented programming simultaneously with physics course material becomes possible. While mixing serious academics with deep coding is still regarded as heresy, I’m convinced it must be a part of serious academics in the near future.
GPI’s facilitate a tree of programming projects for a given course. Such project trees make up a CodeIt system. Students learn how to saw-off one or more branches of CodeIt trees to build their own applications as homework or lab projects. Eventually, they can build applications of sufficient complexity to aid in their thesis or dissertation research projects. Also, select CodeIt applications may be added to the LearnIt collection, a way for a student to first “publish” his or her best work. Each LearnIt program is supposed to have an accompanying expository text and on-line help text.
Listed below are Units 1-8 with some LearnIt and CodeIt programs that apply to each.
Unit 1 Review of elementary mechanics of velocity, momentum, energy, and fields.
BounceIt , AnalyIt, and BoxIt with help from CoulIt and ColorU(2).
Unit 2 Lagrange and Hamiltonian mechanics.
TrebuchIt and BoxIt with help from Pendulum and Cyclotron.
Unit 3 Coordinates and transformations.
CoordinIt and AnalyIt with help from TrebuchIt.
Unit 4 Oscillation and waves.
OscillIt , WaveIt, ColorU(2), JerkIt, and BoxIt with help from CnvMolVibes.
Unit 5 Orbits and scattering.
CoulIt and AnalyIt with help from CoulombOrbits.
Unit 6 Rigid and semi-rigid bodies.
RotateIt (Others under development.)
Unit 7 Action , functional variation, and semi-classical mechanics.
ColorU(2) and CoulIt. (Others under development.)
Unit 8 Relativitic mechanics, chaos, and advanced topics.
BohrIt (Ongoing development.)
About the Subject Matter: A Brief Guide
This book is a geometric approach to classical mechanics. By geometry we mean both the Greek and German kind, that is, both the plane geometry of Euclid (~300BC) and the differential geometry of Gauss and Riemann (1800-1900). We begin with ruler&compass constructions of collision mechanics and potentials. Geometry helps clarify the calculus and physics of mechanics and show the symmetry principles behind classical theory that underlie quantum theory, as well.
Unit 1 is a review of elementary mechanics and a preview for later Units. Its geometry is novel and powerful so a lot of ground is covered as are some curious effects, like super-elastic bounce and supernovae. Oscillator and Coulomb potential models of Earth inside and out are introduced to preview detailed treatments in Unit 4 and Unit 5, respectively. Simple oscillator motion is introduced for Unit 4 in a merger of calculus, U(2) algebra, and elliptic geometry. The latter allows an elegant development of quadratic forms, Hamilton-Lagrange functions, Legendre contact transformation, and Poincare invariant action, all previews of Unit 2 thru Unit 7. Complex variables and fields are illustrated clearly.
Unit 2 develops Lagrange and Hamilton mechanics using an ancient war machine as the object of study. The trebuchet or ingenium is a super-catapault used between 3000 BC in China and 1500 AD that duplicates the human motions of throwing, reaping, chopping, and digging that built our culture. It also duplicates quite instructively the motions used in modern sports of baseball, tennis, and golf and it is shown how one may improve one’s swing in any such sport (and ring the bell at the fair!) After this it should be more difficult to claim that classical mechanics has become generally irrelevant.
Unit 3 redoes the Lagrange-Hamilton mechanics using the covariant notation of Christoffel and Riemann differential geometry that is used for relativistic mechanics. The advantage of the Riemann equations for both numerical simulations and deeper understanding of “fictitious” forces is shown.
Unit 4 treats oscillation and resonance beginning with the forced damped harmonic oscillator and Lorentz-Green’s functions. As in Unit 1, the geometry of phasor clocks is used but now in connection with complex algebra. Fourier analysis is developed both in its discrete series and as a continuum limit. Geometry again provides a view of points heretofore unseen. An example is a way to get relativity and relativistic mechanics from wave interference geometry. This is detailed in Unit 8.
Unit 5 treats orbits in central fields including a continuation of Unit 4 geometry of 2D harmonic oscillation and Coulomb orbits. Here a geometric side is particularly powerful in analyzing whole families of orbits. (See cover design.) Multi-particle scattering and orbits include a continuation of the Unit 1 treatments of super-elastic bounce involving multiple superball towers.
Unit 6 treats rigid bodies and gyroscopic motion. The ellipse geometry of Unit 1 is again helpful and shows rigid body mechanics from both Lagrangian and Hamiltonian viewpoints. The notion of the rotational energy surface (RES) is original geometric approach to molecular rotational spectra.
Unit 7 develops applications of calculus of variations and contact transformations to theoretical mechanics, both classical and quantum. Poincare’s invariant action introduced in Unit 1 is developed to give Hamilton’s Principal action, Hamilton’s characteristic action, and the Hamilton Jacobi equations. A family of simple trajectories in uniform gravity is used to demonstrate the action theory. A numerical technique of coloring trajectories according to action is demonstrated to yield quantum wave shapes.
Unit 8, an introduction to advanced topics, will forever be “in development.” Its first topic is an original wave dispersion derivation of relativity and quantum theory that is so simple it takes only a few strokes with a ruler & compass! In the process it derives and demystifies advanced mechanics and exposes Lagrangian, Hamiltonian, and action as wavelike child’s play. An extension of these ideas in optimal control theory may actually be useful in what is now called “Quantum Control.”.
Brief comparison to other texts.
This book is most in line with texts that many regard as outside the mainstream including the Feynman Lectures by Feynman, Leighton, and Sands, The Berkeley Series on Physics 3. Mechanics by Frank Crawford, Mechanics by Landau and Lifshitz, and Classical Mechanics by Arnold. I have often found the Russian School of mechanics to be ahead of others for most things.
This book is least like the most famous text, Mechanics by Goldstein, and for good reason. This was a text that many US physicists used in their introduction to classical mechanics. The results have not been good. Our own department was among several that decided to vote the classical mechanics graduate course off the Island of the Required! Indeed, if Goldstein had been my source, I may well have gone along with that decision. Formalism for the sake of formalism is silly.
Instead, I decided to fight for the subject of classical mechanics as well as corresponding improvements in teaching quantum mechanics. This text, Classical Mechanics with BANG! with a corresponding and closely related text, Quantum Theory for the Computer Age, are the result of this ongoing effort to bring back Occam’s Razor. “Pluralitas non est ponenda sine neccesitate” (Plurality should not be assumed without necessity), William of Ockham (~1285-1349)
In other words, “Keep it simple and make it powerful!” or “Assume the least, prove the most.”
I hope these words (and equations combined with geometry) will serve you well.
William G. Harter
Fayetteville, Arkansas
August 2010

Basic ideas of velocity, momentum, and kinetic energy (KE) are reviewed using geometry and super-ball collision experiments involving two different masses. The idea of potential energy (PE) and force is introduced by defining PE as the KE of “idler” balls that provide force fields for others. The two most famous PE functions, those of Coulomb and of a harmonic oscillator or linear (Hooke-Law) force are introduced. Elliptic orbit geometry in the latter serves to introduce quadratic forms. This helps derive more advanced ideas of Lagrange, Hamilton, and Poincare and clarifies basic axioms of classical mechanics. A review of complex analysis of functions and fields sets the stage for use in later Units.
-Unit 1 - Review of Velocity, Momentum, Energy, and Fields........................ 11
Chapter 1. Velocity, slope geometry, and trigonometry................................................................................................. 11
Right-handed Cartesian coordinates................................................................................................................ 13
Change and delta variables............................................................................................................................ 14
Slope and delta ratios.................................................................................................................................. 14
Slope angles and ratios.................................................................................................................................... 15
Exercises for study of slope and trigonometry...................................................................................................... 17
Arc functions................................................................................................................................................. 18
Know your calculator and ATAN, too! (atan2(y,x))........................................................................................... 20
Chapter 2. Velocity and momentum........................................................................................................................... 21
Momentum exchange: a zero-sum game.............................................................................................................. 21
Deducing (perfect?) conservation from (ideal?) symmetry............................................................................................ 23
Galilean time-reversal symmetry....................................................................................................................... 23
Galilean relativity and spacetime symmetry......................................................................................................... 25
Geometry of Balance: Center of Momentum (COM) and Center of Gravity (COG)...................................................... 26
Chapter 3. Velocity and energy................................................................................................................................. 29
Time symmetry and energy conservation................................................................................................................. 29
Time symmetry............................................................................................................................................. 29
Kinetic Energy conservation............................................................................................................................. 29
Kinetic energy ellipse and momentum line.......................................................................................................... 30
Momentum vs. energy (Bang for the buck!)......................................................................................................... 33
Quick review of kinetic relations and formulas..................................................................................................... 33
Relations of energy W and space x................................................................................................................. 33
Relations of momentum P and time t............................................................................................................. 33
Exercise 1.3.2. Quick construction of Energy ellipses........................................................................................... 37
Chapter 4. Dynamics and geometry of successive collisions........................................................................................... 39
Independent collision models (ICM)...................................................................................................................... 41
Extreme and optimal cases............................................................................................................................... 42
Integrating velocity plots to find position........................................................................................................... 43
Vector notation and space-space plots................................................................................................................. 46
Help! I’m trapped in a triangle...................................................................................................................... 49
Two balls in 1D vs. one ball in 2D............................................................................................................... 49
Angle of incidence=Angle of reflection.......................................................................................................... 49
Bang force................................................................................................................................................. 49
Kinematics versus Dynamics............................................................................................................................ 50
Dynos and Kinos: Classical vs. quantum theory.............................................................................................. 50
Chapter 5 Multiple collisions and operator analysis...................................................................................................... 53
Doing collisions with matrix products.................................................................................................................... 53
Rotating in velocity space: Ticking around the clock............................................................................................. 55
Statistical mechanics: Average energy............................................................................................................ 56
Bonus: Rational right triangles..................................................................................................................... 57
Reflections about rotations: It’s all done with mirrors............................................................................................... 57
Through the clothing store looking glass............................................................................................................ 59
How fundamental are reflections?....................................................................................................................... 59
Chapter 6 Force and potential energy.......................................................................................................................... 63
MBM force fields and potentials............................................................................................................................ 63
Isothermal model force laws............................................................................................................................. 64
Adiabatic force laws........................................................................................................................................ 65
Conservative forces and potential energy functions................................................................................................ 65
Is it +or-? Physicist vs. mathematician and the 3rd law...................................................................................... 65
Isothermal “Robin Hood”and “Fed rules”......................................................................................................... 66
Oscillator force field and potential...................................................................................................................... 67
The simplest force field F=const........................................................................................................................ 68
Action is conserved (sort of)............................................................................................................................. 68
Monster mass M1 and Galilean symmetry (It’s deja vu all over, again.)..................................................................... 71
Chapter 7 Interaction Forces and Potentials in Collisions............................................................................................... 74
Geometry of superball force law............................................................................................................................ 74
Dynamics of superball force: The Project-Ball story.................................................................................................. 74
The trip to Whammo...................................................................................................................................... 74
Eureka! Polka-dots save Project Ball.................................................................................................................. 74
The “polka-dot” potential................................................................................................................................. 74
Force geometry: Work and impulse vs. energy and momentum................................................................................... 74
Kiddy-pool versus trampoline........................................................................................................................... 74
Linear force law, again (But, with constant gravity, too)........................................................................................ 74
Why super-elastic bounce?................................................................................................................................... 74
RumpCo versus Crap Corp................................................................................................................................ 74
Seatbelts and buckboards.................................................................................................................................. 74
Friction and all that “dirty” stuff........................................................................................................................ 74
Chapter 8 N-Body Collisions: Two’s company but three’s a crowd.................................................................................. 74
The X3: Three-ball towers................................................................................................................................ 74
Geometric properties of N-stage collisions.......................................................................................................... 74
Supernovae super-duper-elastic bounce (SSDEB).................................................................................................. 74
Newton’s balls............................................................................................................................................... 74
Friction, again: Inelastic energy-momentum quadratic equations.............................................................................. 74
Geometric construction of elastic and inelastic energy ellipses................................................................................. 74
Ka-Runch-Ka-Runch-Ka-Runch-Ka-Runch-…:Inelastic pile-ups.............................................................................. 74
Ka-pow-Ka-pow-Ka-pow-Ka-pow-…:Rocket science............................................................................................. 74
Chapter 9 Geometry and physics of common potential fields.......................................................................................... 74
Geometric multiplication and power sequences......................................................................................................... 74
Parabolic geometry......................................................................................................................................... 74
Coulomb and oscillator force fields........................................................................................................................ 74
Tunneling to Australia: Earth gravity inside and out.............................................................................................. 74
To catch a falling neutron starlet....................................................................................................................... 74
Starlet escapes! (In 3 equal steps)....................................................................................................................... 74
No escape: A black-hole Earth!......................................................................................................................... 74
Oscillator phasor plots and elliptic orbits............................................................................................................ 74
Chapter 10 Calculus of exponentials, logarithms, and complex fields............................................................................... 74
The story of e : A tale of great intrest................................................................................................................. 74
Derivatives, rates, and rate equations.................................................................................................................. 74
The binomial expansion.............................................................................................................................. 74
General power series approximations.................................................................................................................. 74
Sine-wave power series.................................................................................................................................... 74
Euler’s theorem and relations............................................................................................................................ 74
Wages of imaginary intrest: Phasor oscillation dynamics....................................................................................... 74
What Good Are Complex Exponentials?............................................................................................................. 74
Complex numbers provide "automatic trigonometry"....................................................................................... 74
Complex exponentials Ae-iωt tracks position and velocity using Phasor Clock...................................................... 74
Complex numbers add like vectors................................................................................................................. 74
Complex products provide 2D rotation operations............................................................................................. 74
Complex products set initial values............................................................................................................... 74
Complex products provide 2D “dot”(•) and “cross”(x) products............................................................................. 74
Complex deriviative contains “divergence”(∇•F) and “curl”( ÑxF) of 2D vector field................................................ 74
Complex potential φ contains “scalar”( F= ∇F) and “vector”( F=∇xA) potentials..................................................... 74
Complex integrals ∫f(z)dzcount “flux”( ∫Fxdr) and “vorticity”( ∫F•dr).................................................................... 74
Complex derivatives give 2D multipole fields.................................................................................................. 74
Complex power series are 2D multipole expansions.......................................................................................... 74
Complex 1/z gives stereographic projection.................................................................................................... 74
Cauchy integrals............................................................................................................................................ 74
Chapter 11. Oscillation, Rotation, and Angular Momentum........................................................................................... 74
Keplerian construction of elliptic oscillator orbits..................................................................................................... 74
Elementary ellipse construction......................................................................................................................... 74
Orbiting versus rotating: Centripetal versus centrifugal.......................................................................................... 74
Circular curvature........................................................................................................................................... 74
More inertial forces: Coriolis and tidal forces....................................................................................................... 74
Vector analysis and geometry of elliptic oscillator orbit............................................................................................. 74
Matrix operations and dual quadratic forms.......................................................................................................... 74
Slope multiplication and eigenvectors................................................................................................................ 74
Geometric slope series..................................................................................................................................... 74
Angular momentum and Kepler’s law................................................................................................................. 74
Flight of a stick: Introducing geometry of cycloids................................................................................................... 74
Center of percussion, radius of gyration, and “sweet-spot”...................................................................................... 74
Chapter 12. Velocity vs momentum functions: Lagrange vs Hamilton............................................................................. 74
Relating energy ellipses in velocity and momentum space.......................................................................................... 74
Lagrangian, Estrangian, and Hamiltonian functions............................................................................................... 74
L, E, and H ellipse geometry............................................................................................................................ 74
Legendre contact transformations....................................................................................................................... 74
Poincare’s invariant and action.......................................................................................................................... 74
Appendix 1.A Vector product geometry and Levi-Civita εijk............................................................................................ 74
Determinants and triple products........................................................................................................................ 74
Operator products........................................................................................................................................... 74
Unit 1 Review Topics and Formulas.......................................................................................................................... 74
Unit 1 Problems.................................................................................................................................................... 74
A 4-ton SUV going 60mph approaches a 1-ton VW going 10mph. (Fig. 1.1a.) The SUV driver is busy text-messaging on a cell-fax instead of watching the road ahead.
Ka-runch! The SUV rear-ends the VW. (Fig. 1.1b.) What happens then?
Well, both vehicles suddenly change speed. Our job is to figure out those speed changes. (See question marks in Fig. 1.1c.) The answers that we find later will depend upon whether the collision is a “ka-runch!” or a “ka-bong!” or (more likely) an intermediate “ka-whump!” as discussed shortly.

Fig. 1.1 Time vs. space graphs of (a) SUV (going 60mph) and VW (going10mph), (b) collision, and (c) possible outcomes of two extreme cases: the inelastic “ka-runch!” and perfectly elastic “ka-bong!”
Our job is a lot easier than what first-responders, doctors, lawyers, insurance agents, ministers, or psychologists do to deal with results of such speed changes. Such difficult human problems are quite beyond our scope here. Also, I can’t say why so many people “need” n-ton SUV’s, but I do know you could get $100,000 off 2008 taxable income by buying an SUV provided it weighs over 6 (six) tons!
My hope is that graphical analysis of physics and economics may help avoid injury due to either one. Graphs ought to give quantitative results while helping to expose logic. Our first graph (Fig. 1a) is a time vs. distance plot. It shows speed by slope-from-vertical. It has been used for space-time relativity since Herman Minkowski, one of Einstein’s math profs, suggested it. Calculus texts use a distance vs. time plot to show speed by slope-from-horizontal as Newton liked to do. Fig. 1.2 compares the two. They both use a 1:1 ratio (45°slope=1/1) to represent 60 mph = 1 mile/min. in (a) but also 1 min./mile in (b).

Fig. 1.2 Comparing slope (a) Minkowski time vs. space plots vs. (b) Newton’s space vs. time plots.
The plots (a) and (b) are complimentary; (a) is transformed into (b) by doing a mirror-reflection across the 45° diagonal (1:1)-SUV-line, the one line that is the same in (a) or (b). I prefer (a) for vehicular dynamics since cars usually go horizontally. (With (b) you might ask, “How do cars climb walls?”)
Now, slope is defined as the ratio Δy/Δx of vertical altitude Δy per horizontal base Δx. This equals velocity v=Δx/Δt for a horizontal time-t-axis and vertical space-x-axis like Fig. 1.2b. So horizontal x-axis and vertical time-t-axis of Fig. 1.2a has slope=Δt/Δx=1/v inverse to Fig. 1.2b slope. The lowest slope=1/10 in Fig. 1.2a belongs to jet velocity v=600mph that is the highest slope=10/1 in Fig. 1.2b, and a low VW velocity of v=10mph has a steep triangle of slope=6/1 in Fig. 1.2a but in Fig. 1.2b that VW line is a low slope=1/6.
Each unit graph square in Fig. 1.2a has a horizontal scale factor of sx=0.1mile(per square) and a vertical scale factor of sy=6sec.(per square) and vice versa for Fig. 1.2b. If you multiply scale sx by factor fxand sy by fythen each graph slope ![]() =(ny vert. squares)/(nx horiz. squares) changes to (fx/fy)
=(ny vert. squares)/(nx horiz. squares) changes to (fx/fy)![]() .
.
We do rescaling of dimensions to change units. For example, changing miles to feet in Fig. 1.2a uses factor fx =5,280 ft. per mile(or ![]() ) and changing minutes to seconds uses fy =60
) and changing minutes to seconds uses fy =60![]() . The scale ratio (fx/fy) is 88, that is, 60mphequals 88
. The scale ratio (fx/fy) is 88, that is, 60mphequals 88 ![]() . SUV slope of 1 in Fig. 1.2b is 88 in a ft. vs. sec.plot. That’s too high to plot 60mph accurately but a ft. vs. sec. or ft. vs. min.plot will be more appropriate for parking lot speeds.
. SUV slope of 1 in Fig. 1.2b is 88 in a ft. vs. sec.plot. That’s too high to plot 60mph accurately but a ft. vs. sec. or ft. vs. min.plot will be more appropriate for parking lot speeds.
Most of us learn to measure slope by degrees(°)of a slope angle s. Greek “s” or sigma s stands for sector slope. (We also use theta (q) or phi (f).) But, degrees are an arbitrary choice of 180° per (1/2)-turn or 360° per full turn. A better unit is 1 radian=180/π~57.3°. A s=1radian-sector on unit circle (r=1) (Fig. 1.3a) has unit arc-length (l=s·r=1) and unit sector area (A=s·r2=1) based on π=3.14159…, not arbitrary numbers.

Fig. 1.3 (a) Definition of unit angle (s =1) on unit circle (r =1) (b) A quarter turn sweeps half the area.
The trick here is that the sector slope line sweeps out two pieces of the pie to make a whole pie or area pi=π if angle s is π or 180°The 1/4-circle angle s=p/2 in Fig. 1.3b sweeps area πr2/2=π/2 of half a pie. It may not be how you serve pie, but it’s how mathematicians serve π. (There (or their) pie (or pi) are squared!)
Actual slope is the tangent of angle s written tansand so called since it is the length of a line tangent to or “touching” a unit circle from angle s to x-axis. (See Fig. 1.4b.) Another triangular ratio is the sine or sinsthat stands (I’m guessing) for “slope over incline.” The tangent in Fig. 1.4 is an a:b ratio (![]() ), but the sine is an a:rratio (
), but the sine is an a:rratio (![]() ) that civil engineers use to “grade” roads.
) that civil engineers use to “grade” roads.
percent-grade=100·(altitude Dy gained)/(distance Dr traveled) =100 sin s
High grades are good in school but bad for roads. An interstate highway would “flunk” anywhere its grade was above 5%. This changed in 2001 with the Bush administration’s “No Road Left Behind” policy.
Each triangle ratio switches places with its codependent ratio if you switch x-and-y-axes (or altitude-and-base) or switch Fig. 1.2a Minkowski plots to Fig. 1.2b Newton plots. For example, a cotangent ratio ![]() is codependent to tan s, and cosine ratio
is codependent to tan s, and cosine ratio ![]() is codependent to sin s.
is codependent to sin s.
In comparing (a) vs. (b) in Fig. 1.2 we saw that a slope (like 6/1) in (a) is inverse slope (1/6) in (b). (That was for the 10mph VW.) In other words, any slope ![]() in (a) becomes
in (a) becomes ![]() in (b). Also any slope angle s in (a) becomes a compliment
in (b). Also any slope angle s in (a) becomes a compliment![]() to angle s in (b). (See Fig. 1.4a.)
to angle s in (b). (See Fig. 1.4a.)
From the two preceding paragraphs we deduce that any ratio like sins or tans for angle smust equal its co-ratio for the compliment sc=p/2-s, and vice versa.
![]()
Two other ratios use secant (or “sword-like”) lines that pierce the circle in Fig. 1.4b. The horizontal line is a secant ratio ![]() and its co-ratio is a cosecant ratio
and its co-ratio is a cosecant ratio ![]() .
.

Fig. 1.4 (a) Right triangle geometry for s=1 slope (b) Triangle ratios for s=1 and (c) s=p/2.
Fig. 1.4b has eight different but similar triangles with the same angles (s,p/2,sc) as the triangle in Fig. 1.4a. Can you spot them? Whether big or small, similar triangles share ratios (sine, cosine, or tangent) if (and only if) they share angles. To do geometry problems we look for “hidden” similar triangles and hidden right triangles that form similar rectangles. Right triangles have relation a2+b2=r2 of Pythagoras (~570 BC).
One secret is to visualize sequences of scale change or rotation transformation as in Fig. 1.5 where each rectangle is rotated by 90°and shrunk by a factor cots=64.2%. Rectangle diagonals in Fig. 1.5a (and sides in Fig. 1.5b) give a power sequence (…tan1s,tan0s=1,(tans)-1=cot1s,(tans)-2=cot2s,(tans)-3=cot3s,…).
A power sequence is also called a geometric sequence since it is suggested by geometry. A rectangle sequence in Fig. 1.5a is lined up with the XY coordinates of the page, that is, each side has zero or infinite slope but the first diagonal (tans) has a negative slope angle of -sc = –1-radian or –57.3°. The sequence in Fig. 1.5b begins with a rectangle side (tans) at angle –57.3°. Each sequential rotation in either figure is 90°clockwise around the original tangent point with rectangle size shrunk by factor cots=64.21%each time.

Fig. 1.5 Geometric cots=0.6241 sequences of whirling rectangle segments based on slope angle s=1.
1. Construct whirling square diagrams for 60° slope angle s=p/3 without using protractor. First compare the precision of graph-derived values of sins, coss, tans, with algebraic and/or calculator-derived numbers.
Only certain angles have exact Euclid rule&compass construction and s=60° is one of them. (But, s=1 isn’t!) If you could “straighten” the (l=1)-arc of a (s=1)-sector (Fig. 1.3a) to one (r=1)-side of an equilateral triangle, its slope angle would grow from s=1=57.3°to s=π/3=60° as shown in Fig. 1.6b.
To construct a 60° slope a¢ la Euclid, draw a radius-(r=1) circle by compass and use the same radius-r setting to strike an arc from Xpoint-(x=1,y=0) to locate R as in Fig. 1.6b. So now, theoretically, arc-RX is l=π/3=1.0472…long approximately but line-RX has length-(r=1) exactly. At 2-figure precision both have length 1.0, but at 3-figure precision, arc-RX length is 1.05, 5% greater than line-RX length 1.00.
Whether a math or physics theory is “correct” or not depends on our level of precision. As we will see, it is pretty tough to get level-3 absolute precision (1 part in 1,000) with ruler and compass construction but level-2 is pretty easy. By taping fishing line onto arc-RX, we can see that it is about 5% shorter than a unit line, but measuring 4.7% is challenging and 4.72% requires tools most don’t have.
We easily get level-9 precision by poking sin(π/3) into a calculator (or sin60° if set for degrees) to get sin(π/3)=0.866025403…. but only can estimate 0.86 or 0.87in Fig. 1.6b graph as indicated by ??? marks.
To construct the tangent declination by compliment angle sc= π/2-π/3= π/6 (or 90°-60°=30°) we strike a unit arc off the –Y point to intersection point Q on the 4th quadrant-YQX of unit circle in Fig. 1.6c. The line OQ thru point Q is perpendicular or normal to original slope line OR since sc+s is π/2(90°) for any s.
This line OQ drawn thru point Ris the tangent decline we need for this problem. Just redo arc inter-sector -YQO to make sector NPR centered at R instead of O. Then draw tangent line PR so it extends down to secant point S on the X axis and up along the cotangent line to the cosecant point on the Y axis.

Fig. 1.6 Details of a geometric construction of Fig. 1.5 for slope angle s=p/3(60°)
Segments OS and YR provide numerical estimates of calculated values sec(π/3)=2.000 and csc(π/3) =1.155 along X and Y axes, respectively, in Fig. 1.6d. The value sec(π/3)=2like its inversecos(π/3)=1/2 is exactly rational, a nice feature of a (30°,60°,90°)-triangle with side ratios (b:a:r)=(1:√3:2) (It is a right triangle, so: a2+b2=r2.) The “30-60” is a famous right triangle students must learn. Others are “3-4-5” ((a:b:r)=(3:4:5)) and the “45” ( (45°,45°,90°)or(a:b:r)=(1:1:√2)). A “Golden” ratio ![]() triangle is very cool (and rich).
triangle is very cool (and rich).
So far we give an angle or unit-circle arc s and construct or calculate trigonometric functions of s including a=sin s, b=cos s,t=tan s, 1/a=csc s or their co-functions. Now consider the reverse or inverse case: we are given a, or b, or t etc.and must come up with an arc s (or arcs s1, s2...) that gives a, etc. To do this we find arc-functions arc-sine, arc-cosine… or inverse trig functions sin-1, cos-1…as follows.
s =arcsin(a)=sin-1(a), s=arccos(b)=cos-1(b), s =arctan(t)=tan-1(t),…
The exponential (-1)-notation seems to confuse sin-1(a)with (sin(a))-1=1/(sin(a)) that we do not want here. (However, it is conventional to write (sin(a))n=sinn(a)or any power but (-1).)
Algebra of arc-functions is trickier than algebra of functions themselves. Geometric constructions of sin-1, cos-1…etc.are not so tricky but quite simple and revealing. To find sin-1(0.5), for example, we draw a horizontal line at y=0.5 and see where it intersects the unit circle. (Fig. 7a) Nothing to that! Except, we see there are two angles s1=π/3 and s2=2π/3 that give sins1=0.5=sins2. The same applies to cos-1(0.5) except now the angles are ±π/3. (Fig. 1.7b) Note the antipodal (±180°) angles that equal tan-1(0.5). (Fig. 1.7c)

Fig. 1.7 Geometric construction of arc-trig functions of 0.5=![]() . (a) sin-1(
. (a) sin-1(![]() ) (b) cos-1(
) (b) cos-1(![]() ) (c) tan-1(
) (c) tan-1(![]() )
)
More challenging is finding arc-secant (say, sec-13.0) by geometry. Try it first without looking at the answer.
Solution Hints:
We need to find the tangent that goes from 3.0 to touch the circle. A circle of radius r=3.0concentric to the unit circle has rectangle tangents of that size that we copy from x=3.0 to touch unit circle.

Fig. 1.8 Geometric construction of arc tangent, arc secant, and geometric-mean square-root.
Or else we simply draw rectangle diagonal thru unit circle. This leads to Euclid’s Geometric Mean construction of a product square root √(a·b). Here it is √8=2.82…and is the desired tangent in this case.
Trig function plotting exercises
Use ruler&compass to plot the function y=cos(x) and y= cos-1(x)=arccos(x). Do y=sin(x)and y=sin-1(x).
Begin by constructing a 12-pt “clock” circle. Repeat using 45° diagonals to make a 24-hr clock.
Then you project the 24 points horizontally fory=cos(x) and vertically y=cos-1(x)=arccos(x).
Shift the plot by 3 hours (90°) to get the sine and arc-sine functions. Each “hour” is angle 15° or π/6.
As we see later and in Unit 4, sinusoidal waves are really important curves!

Recall the car-crash problems discussed first in Chapter 1 regarding Fig. 1.1. The first one involves a text-messaging driver of 4-ton SUV going 60mph SUV rear-ending a dawdling 1-ton VW going 10mph. (Fig. 1.1b.) What happens then? What velocity or velocities do the cars have just afterwards?
As sketched in Fig. 1.1b, the answer depends on whether it’s“Ka-Runch” or “Ka-Bong” or some more generic noise like “Ka-whump”. By“Ka-Runch” we mean the cars crumpled enough to become interlocked into one hunk of metal weighing 5 tons. (4+1=5) This is a simple problem that is solved by drawing a line of slope (–4/1) on a velocity vs. velocity graph from before-crash-point ![]() to where that line intersects the red 45° (VSUV=VVW)-line at the after-crash-point
to where that line intersects the red 45° (VSUV=VVW)-line at the after-crash-point![]() (Fig. 2.1)
(Fig. 2.1)

Fig. 2.1 Anatomy in velocity space of a “Ka-runch!” that is an extreme inelastic collision.
The logic behind a (VSUV=VVW)-line is that interlocked vehicles have equal velocity. The logic behind a Ka-Runch-line of slope (–4/1) is subtler. It is due to Newton’s 1st axiom or “law” that says Nature conserves so-called momentum, a sum of products of each mass with its velocity. It’s a law we can live with but, how?
During the car crash the velocity coordinate pair (VSUV ,VVW) change very rapidly in moving from initial point I at (60,10) to final point F at (50,50) in Fig. 2.1. The Ka-Runch takes less than 1/50th of a second! In that time, SUV is losing one unit of velocity for every four units gained by VW since SUV is four times heavier than VW. Newton writes this as a total momentum conservation equation.
PSUV +PVW =MSUV·VSUV+ mVW·VVW = PTotal =constant (2.1)
Checking (2.1) with Fig. 2.1 gives a total momentum PTotal =250 that neither SUV and VW can change.
4·60+1·10 =4·VSUV+1·VVW =4·50+1·10 = PTotal =250 (2.2)
The change of PTotal must be zero (<ΔPTotal =0) before, during, and after the crash. It’s a zero-sum game.
MSUV·DVSUV+ mVW·<ΔVVW = ΔPTotal =0 (2.3)
Dividing by SUV change-of-velocity (<ΔVSUV) and VW mass (mVW) gives the slope relation in Fig. 2.1.
PTotal is also conserved in an ideal Ka-Bong of Fig. 2.2. Here cars bounce off each other without damage. That’s unlikely at 60mph speeds! So Fig. 2.2 is rescaled to units of feet per minute. Then initial ![]() =60 feet per minute=1ft. per sec. is more like a parking lot speed. (Insurance claims are a lot less!) The VW is bumped from an initial
=60 feet per minute=1ft. per sec. is more like a parking lot speed. (Insurance claims are a lot less!) The VW is bumped from an initial ![]() =10 ft per min to
=10 ft per min to ![]() =90 ft per min=1.5 fps=1.02 mph. To find
=90 ft per min=1.5 fps=1.02 mph. To find ![]() in Fig. 2.2, draw an arc from initial I-pt (60,10) to hit final F-pt (40,90). Arc-center is Center of Momentum COM pt-(50,50) on the 45° line. (It’s the final point if cars get “stuck” to each other as they do in a Ka-Runch like Fig. 2.1.)
in Fig. 2.2, draw an arc from initial I-pt (60,10) to hit final F-pt (40,90). Arc-center is Center of Momentum COM pt-(50,50) on the 45° line. (It’s the final point if cars get “stuck” to each other as they do in a Ka-Runch like Fig. 2.1.)

Fig. 2.2 Anatomy in velocity space of a “Ka-Bong!” that is an extreme or ideal elastic collision.
The Ka-Bong in Fig. 2.2 is like the Ka-Runch in Fig. 2.1 followed by an equal but opposite rebound or hcnuR-aK (un-crash) that undoes the “damage” by the Ka-Runch. Now you might ask, “Is this possible outside of the cartoon world or a video game?” Well, certainly not at high speeds and not quite at low speeds.
Only in a quantum nano-world do perfectly elastic processes exist. Any collision of classical objects, however gentle, will permanently disturb or exchange thousands or millions of atoms and electrons. We call this “wear&tear” or entropy growth and ignore it until it has gone too far. (Then, the objects go to a landfill!)
Even gentle bumps like the one starting at initial pt-I in Fig. 2.2 cannot quite go exactly to final pt-F on the COM circle, but collisions with no appreciable damage pass as (almost) elastic or time reversible bumps. A video of the Fig. 2.2 I![]() F bump played backwards looks like an F
F bump played backwards looks like an F![]() I bump that is not extraordinary. But a reversed video of the Fig. 2.1 crash looks like a crazy “un-crash” where ruined cars get reborn like new.
I bump that is not extraordinary. But a reversed video of the Fig. 2.1 crash looks like a crazy “un-crash” where ruined cars get reborn like new.
Newton’s momentum or P-conservation axiom or “law” is one of the most strictly enforced laws in classical physics. (It’s also quasi-conserved in quantum physics that so often seems to get away with utter mayhem!) Momentum is like some kind of fluid that you can buy and sell but cannot create or destroy. In our car bumps or crashes the zero-sum-rule says, “Whatever P the VW gains (or loses) the SUV loses (or gains.)”
A classical law without classical proof remains an axiom until deeper theory may rule on it. Quantum theory has ruled and can shed some light on origin and properties of this mysterious “P-fluid.” It also shows how to cheat P-conservation and other classical “laws” a little. This will be discussed in later units.
In the meantime it is possible to deduce P-conservation using more fundamental axioms that are called symmetry principles. This is a grown-up geometric approach that is also very useful in the quantum world. Most importantly, symmetry helps deduce principles of energy E and E-conservation as discussed below.
Symmetry means “same-etry” or “similarity” or “smoothness” and other “s” words like simplicity. The fancy technical term is isotropy or isometry with iso meaning same. For example, the most symmetric ball would be a sphere since it is isotropic and has the same radius everywhere. A most-isotropic plane or most-symmetric plane is flat and bump-free. Some would say symmetry means Beauty, but others might say it means Boring. Think of a seemingly endless Kansas prairie for either response.
Symmetry can refer to sameness in time as well as in space and often the two are related. (Think of driving across Kansas.) The idea of being time reversible is an example from the preceding page. Another is Galileo’s relative-velocity symmetry or Galilean relativity. Both are behind Fig. 2.3 and Fig. 2.4 below.
Suppose a traffic cop is going 50mph in a lane adjacent to the one occupied by the SUV and VW. He or she records (using radar) the SUV coming up at 60mph, and puts on the blue-light to stop it for exceeding the 20mph limit in a school zone. Just then Ka-Runch! SUV+VW becomes a single 5-ton hunk going 50 mph, the same speed as the cop. (The cop can just reach across to hand SUV a cyber-ticket for (1) speeding in a school zone, (2) improper following, and (3) driving while faxing. c-tickets are costly even for rich SUVites!)
The VVW vs. VSUV graph for the Ka-Runch is shown in Fig. 2.3 as viewed by the 50mph cop. It is the same as Earth-frame-view in Fig. 2.1 except the cop’s speed of 50mph is subtracted from both V-scales. The cop sees a final 5-ton SUV-VW hunk going 0 mph relative to cop-frame or COM frame of SUV+VW.
The VVW vs. VSUV graph for the Ka-Bong in Fig. 2.4 is viewed in the 50mph cop-frame or COM-frame. Again, it’s just Fig. 2.2 with 50mph subtracted off V-scales. Cop or COM-frame view shows simplicity and symmetry. Velocity values simply change sign as theKa-Bong crosses the whole COM-circle diameter.
Initial I-pt (10,-40) ![]() (reflection thru COM pt-(0,0))
(reflection thru COM pt-(0,0)) ![]() final F-pt (-10,40)
final F-pt (-10,40)
Reversing time ![]() makes (-)velocity
makes (-)velocity ![]() and reflects I-pt and F-pt into each other.
and reflects I-pt and F-pt into each other.
Initial I-pt (-10,40) ![]() (reflection thru COM pt-(-0,-0))
(reflection thru COM pt-(-0,-0)) ![]() final F-pt (10,-40)
final F-pt (10,-40)
That is just Fig. 2.4 with blue time-direction arrows reversed. (INITIAL I switches places with FINAL F.)
Elastic collisions (Fig. 2.4) are symmetric and balanced to t-reversal, but inelastic Ka-whump’s are unbalanced if they stop short of the COM circle. A Ka-Runch (Fig. 2.3) is unbalanced to the extreme.

Fig. 2.3 COM-frame or 50mph cop-frame view of a “Ka-runch” inelastic collision of Fig. 2.1.

Fig. 2.4 COM-frame or 50mph cop-frame view of a “KaBong” elastic collision of Fig. 2.2.
This is a common situation in physics. The real (or generic) world lies between extreme ideals that are easiest to quantify. On one hand, we’ll say a Ka-whump that ends up close to its inital COM-circle is elastic or Ka-Bong-like and, on the other hand, a Ka-whump that stops near its COM-point is inelastic or Ka-Runch-like.
Galileo grew up in Renaissance Italy as it flourished from its sea trade. Perhaps, watching ships of trade glide smoothly in the harbor led him to ideas about relativity of velocity. In any case he wrote about comparing what a sailor sees in a ship-frame with what is seen in the Earth-frame. He noted how apparent velocity of an object decreases by subtracting the velocity of the observer’s frame.
Subtraction of the cop’s velocity Vcop=50 from Earth-frame velocity (VSUV,VVW)=(60,10) of SUV and VW in Fig. 2.2 gives their initial velocity (60,10)-(50,50)=(10,-40) in cop-frame.(Fig. 2.4) Such a subtraction (or addition if the cop goes the other way) is a Galilean relativity transformation. Fig. 2.4 is a redrawing of Fig. 2.2 with new (VSUV,VVW) scales, each reduced by 50mph. Or else, you may start with Fig. 2.2 and slide each velocity point down its 45°-line by 50mph, (COM and cop-frame Earth-relative velocity) as in Fig. 2.5a.
This becomes a “slide-rule” in Fig. 2.5b that quantifies several Galilean frames. The initial VW frame (VW(I)) is found where the 45°-I-line hits the horizontal (VVW=0) axis. VW starts in frame-VW(I) and is hit by a (VSUV=50)-SUV that knocks VW into a new frame-VW(F) of final VVW=80 as SUV slows to a final VSUV=30.
Next a final SUV frame (SUV(F)) intersects the 45°-F-line on the vertical (VSUV=0) axis where a final (VSUV,VVW)=(0,50)-point-FSUV(F) results if initially a (VSUV=20)-SUV Ka-Bongs a (VVW=-30)-VW at point-ISUV(F).
Note that seven Ka-Bong lines in Fig. 2.5 show seven different-frame views of the same Ka-Bong. In four frames, one car has V=0 either before or after the Ka-Bong. One frame, the COM has VCOM =0 before and after. That COM-frame is balanced to velocity reversal ![]() . Other frames have distinct V-reversed twins with INITIAL I and FINAL F switched. For example, ISUV(F)
. Other frames have distinct V-reversed twins with INITIAL I and FINAL F switched. For example, ISUV(F)![]() FSUV(F) and FSUV(I)
FSUV(F) and FSUV(I)![]() ISUV(I) are symmetry twins.
ISUV(I) are symmetry twins.

Fig. 2.5 Galilean transform of “KaBong” in Fig. 2.2 to (a) COM-frame and (b) to other frame views.
VCOM identifies a frame and is the weighted average of any VSUV,VVW pair (initial, final, or en flagrante delecti!) on its IF-line. VCOM is zero for the COM frame so its IF-line is the same for +V or -V. (VCOM=±0)
The uniqueness and constancy of a COM for the SUV and VW is connected with underlying space-time symmetry or geometry of spatial balance in Newton’s equation (2.1) repeated here in different forms.
PTotal =PSUV +PVW =MSUV·VSUV+ mVW·VVW = MTOTAL·VCOM=constant (2.5a)
Total momentum is a product of VCOM and total mass MTOTAL=MSUV+mVW of a 5-ton SUV-VW “hunk”. This holds whether the “hunk” forms permanently in a Ka-Runch or the cars bounce off in aKa-Bong or Ka-whump. Both PTotal =MTOTAL·VCOM and VCOM are constant throughout the collision regardless of “auto-elasticity.”
Weighted average VCOM of (VSUV,VVW) is fixed as V go from initial to in-between to final values. Collisions in Fig. 2.1 thru Fig. 2.5 all have VCOM=50 in the Earth frame. The 4:1-weighted average of each coordinate pair (40,90), (50,50), (60,10), (70,-30),etc. on the slope-(-1:4)-line (in Fig. 2.6a below) is VCOM=50.

Fig. 2.6 Geometry of (a) 4:1-weighted velocity average (b) 4:1-weighted coordinate average.
Balance between velocityVSUV and VVW in (2.5b) relates to balance between positionxSUV and xVW.
![]() (2.5c)
(2.5c)
As SUV and VW close, collide, bounce, or stick, the Center of Mass xCOM stays at a constant velocity VCOM. In the COM frame that velocity is zero as sketched in the lower part of Fig. 2.6b. The weighted average (2.5c) of coordinates is also a Center of Gravity and is cartooned by a 4:1 Greek balance.
Exercise 1.2.1 Redraw Fig. 2.5 for initial speeds (VSUV=40,VVW=10) with the SUV only twice the mass of the VW. (Hummer-Lite) Include also a line describing the frame in which the SUV is initially stationary and another for which the SUV is finally stationary.
Exercise 1.2.2 This is a dimensional analysis and power law problem. It involves Olympic weight lifters but is a general piece of mechanics that applies to everything. (Have you wondered why toy cars can fall off cliffs without damage while yours cannot?)
Olympic weight lifters are divided into several classes according to their body weight. Generally the best performers are close to the maximum allowed for their class in all but the largest "open" classes.
(a) From dimensional arguments alone, you can predict that the Olympic records R in a given event (say, the "clean and jerk" which is always the greatest record) should have a definite functional relationship to the weight W=Mg of the performers: R= R(W). Derive R(W) as a power law times an undetermined coefficient.
(b) Obtain a set of records from an almanac or book of records, and plot them against W for a given event or events. See how well your theory and experiment jive. (Hint: It is most convenient to plot on log-log graph paper. Why?)
(c) Use the results of (a) and (b) to answer: How many times his bodyweight could a man lift if he was the size of an ant with a mass of M = 1 gm.? (A real ant is supposed to lift five or ten times its body weight. How much better or worse is the ant doing than "Antman"? )
We noted that reflection symmetry or balance in space is connected with momentum or P=m·V conservation. Uniformity or “sameness” of coordinate and velocity space means the SUV can lose a unit of momentum only if the VW gains that unit, and vice versa. Momentum is a zero-sum game that does not depend on whether the two protagonists bounce elastically or crumple in-elastically during their collisions.
Now we consider symmetry or balance in time. This is connected with a something called energy that also plays a conservation zero-sum game but, unlike momentum, requires elastic (Ka-Bong!) collisions. While momentum conservation is axiomatic, energy conservation can be derived from the former. Let’s do that.
Symmetry balance in Fig. 2.6 is between pairs of velocity values (VSUV,VVW) or spatial coordinates (xSUV,xVW) of the colliding SUV and VW. Weighted average (2.5b) equals the same VCOM for the initial pair ![]() , the final pair
, the final pair ![]() , or a pair
, or a pair ![]() at anytime t. (Recall (2.1) and (2.5), too.)
at anytime t. (Recall (2.1) and (2.5), too.)
We subtract IN’s from FIN’s to isolate SUV terms from VW terms and redo zero-sum relation (2.3).
![]() (3.2b)
(3.2b)
(Ch.1 introduces Delta notation![]() .) Here is another way to write the zero-sum relation.
.) Here is another way to write the zero-sum relation.
Now consider balancing IN vs. FIN pair ![]() for SUV or
for SUV or ![]() for VW. Elastic (Ka-Bong!) cases in Fig. 2.2 or Fig. 2.6 show how VCOM is a balanced IN-vs.-FIN pair-average of both SUV and VW.
for VW. Elastic (Ka-Bong!) cases in Fig. 2.2 or Fig. 2.6 show how VCOM is a balanced IN-vs.-FIN pair-average of both SUV and VW.
This is an algebraic statement of a time reversal symmetry axiom or IN vs. FIN balance mentioned earlier. For ideal elastic (Ka-Bong!) collisions, IN and FIN points balance around the COM point. Switching past and future gives a similar Ka-Bong and not a miraculous “un-crash” that shows up for VFIN closer to VCOM than VIN.
A definition of energy is derived by multiplying space and time balance equations (3.3) with (3.4)
![]()
Then adding the (-)-terms to both sides isolates IN-terms. A FIN-sum is proved to equal an IN-sum.
![]() (3.5a)
(3.5a)
This![]() M·V2 is kinetic energy (KE) and it is conserved by a relation like (2.5a) for momentum P=M·V.
M·V2 is kinetic energy (KE) and it is conserved by a relation like (2.5a) for momentum P=M·V.
![]() (3.5b)
(3.5b)
![]() (2.5a)repeated
(2.5a)repeated
Conservation relations are insensitive to overall factors. So is factor ![]() in (3.5a) fortuitous? Well, KE can be defined by integral relation
in (3.5a) fortuitous? Well, KE can be defined by integral relation ![]() .(See below.) A V vs.P plot is a triangle with base P=M·V, altitude V, and area KE=
.(See below.) A V vs.P plot is a triangle with base P=M·V, altitude V, and area KE=![]() =
=![]() M·V2. With
M·V2. With ![]() our product (3.3)·(3.4) above is
our product (3.3)·(3.4) above is![]() =
=![]() M·V2.
M·V2.
Momentum-conservation relation (2.5a) is rearranged for plot geometry.
The VSUV-vs-VVW-plot of (3.6a) in Fig. 3.1 is a line of slope –MSUV/mVW thru the COM-point (VCOM ,VCOM).
y-y0=m·(x-x0) where: ![]() and:
and: ![]() (3.6b)
(3.6b)
Energy conservation relation (3.5a) is rearranged by placing KE and masses into denominator.
The VSUV-vs-VVW-plot (3.7a) in Fig. 3.1 is KE-ellipse (3.7b) of x-radius a and y-radius b to match (3.7a).
![]() where:
where:  (3.7b)
Fig. 3.1 also shows a smaller inelastic Ka-runch-IE-ellipse and a tiny KE-ellipse seen in the COM-frame.
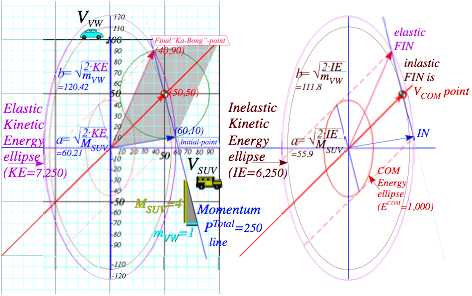
Fig. 3.1 Elastic KE-ellipse hits (PTotal)-line atIN andFIN pts. Inelastic IE-ellipse hits only at VCOM pt.
Elastic KE (VSUV=60, VSUV=10), inelastic IE(50, 50), and ECOM(10, 40) in COM frame is worked out for Fig. 3.1.
The difference in energy between the two extreme types of collision, Ka-Bong and Ka-runch, is 1,000 units in the Earth frame and 1,000 units in the COM frame. But, only in the COM frame does the Ka-runch! take all the kinetic energy and leave both cars standing still. Galilean symmetry says “cost” of damage is the same in all frames. Cost of a generic Ka-whump is measured by what fraction of ECOM=1,000 is lost to inelastic crumpling.
A fine point of Fig. 3.1 geometry deserves notice. The tangent slope to the IE-ellipse at pt-(50, 50) on the 45°(slope-1)-COM-line is that of the momentum line, namely –MSUV/mVW=-4. Conversely, slope of dashed tangent lines to the ECOM(10, 40)-ellipse on (slope=-MSUV/mVW)-line is that of the COM–line, namely slope-1. This beautiful duality is an important part of mechanics, both classical and quantum. Here it has IN and FIN points stay on a (slope=-MSUV/mVW)-line even as they coalesce to a tangent point of non-collision!
Head-on ![]() collisions are plotted in Fig. 3.2 below showing increasing inelasticity in parts (b) and (c). (These involve an M1=6ton SUV satisfying Bush gas-hog entitlement.) The final KE-ellipse shrinks from the initial elastic Ka-Bong ellipse to a smaller inelastic Ka-whump ellipse (Ewhump=231/3 in Fig. 3.2b) and to the totally inelastic Ka-runch-ellipse (IE=14 in Fig. 3.2c).
collisions are plotted in Fig. 3.2 below showing increasing inelasticity in parts (b) and (c). (These involve an M1=6ton SUV satisfying Bush gas-hog entitlement.) The final KE-ellipse shrinks from the initial elastic Ka-Bong ellipse to a smaller inelastic Ka-whump ellipse (Ewhump=231/3 in Fig. 3.2b) and to the totally inelastic Ka-runch-ellipse (IE=14 in Fig. 3.2c).
The “in-between-ideal” or generic Ka-whump cases will each have two possible final F-points where the momentum line cuts the Ka-whump ellipse. The top Fwhump point represents the partial rebound. Below is its symmetry point FPass-thru that represents cars passing through each other. Fortunately, that’s not a usual highway event and certainly not a survivable one. But in the quantum world that’s business-as-usual.
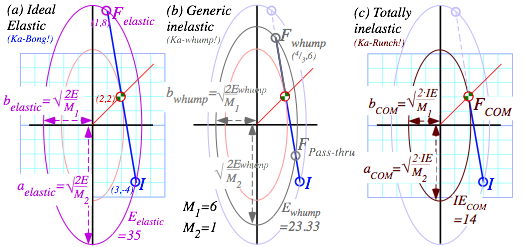
Fig. 3.2 (V1=3, V2=-4) collisions. (a) Elastic (Eloss=0). (a) Generic (Eloss=112/3). (a) Inelastic (Eloss=21=ECOM). (See a summary of this and preceding figures in Fig. 3.3 and 3.4.)
What are momentum P and energy E, really? A flippant answer is Bang! and $Buck$. We pay (a lot) for the latter in order to get the former. A less flippant answer based on space-time relativity and quantum wave theory must wait until Unit 3. But, we can discuss relations involving P=M·V and E=M·V2/2 in the meantime.
Also, there’s the notion of Force. That’s the rate of being banged in bangs per second, if you will. And, there’s Power, the rate of being bucked in $bucks$ per second, if you will. (Or, maybe you won’t.)
What we’re trying to say is that force F is the slope F=![]() on a graph of momentum P vs. time t.
on a graph of momentum P vs. time t.
Also, we’re trying to say that power P is the slope P =![]() on a graph of energy E vs. time t.
on a graph of energy E vs. time t.
And, do not ever forget that velocity V is the slope V =![]() on a graph of position x vs. time t.
on a graph of position x vs. time t.
These and other relations (in calculus form) are collected below in preparation for lots of discussion later on.
The suffix kinetic refers to energy connected directly to velocity of motion (“kinos” means moving). Kinetic energy KE is distinct from potential energy (PE is “stored” energy) or entropic energy (entropy is chaotic or “trashed” energy like heat) that is reviewed later in Ch. 6 and Ch. 7.
We now give a quick algebraic run-down of energy-related formulas to be introduced with more detail and geometry in Ch. 7. (See (7.5a) to (7.5d) in particular.) Readers with calculus or physics knowledge may use this to review to connect our geometrical developments with the more conventional ones.
Energy or work may be defined by a delta-work product ΔW=F·Dx of force F and distance-Dx-pushed. More precisely, W is an integral ![]() , the area of a Fvs.x work-plot. Power, a time rate
, the area of a Fvs.x work-plot. Power, a time rate![]() of energy production, is the product P=F·V of force and velocity
of energy production, is the product P=F·V of force and velocity![]() . So,
. So, ![]() or
or ![]() .
.
Momentum may be defined by a delta-momentum product DP=F·Δt of force F and time interval Dt. More precisely, P is an integral ![]() , the area of a Fvs.t plot. Force, a time rate
, the area of a Fvs.t plot. Force, a time rate![]() of momentum production, is a product F=M·a of mass and acceleration
of momentum production, is a product F=M·a of mass and acceleration![]() . (F=M·a is called Newton’s “2nd Law.”)
. (F=M·a is called Newton’s “2nd Law.”)
With ![]() , energy integral
, energy integral ![]() is
is ![]() , the area under a V vs.P plot where P=M·V is momentum. For a single mass M this area is kinetic energy:
, the area under a V vs.P plot where P=M·V is momentum. For a single mass M this area is kinetic energy: ![]() M·V2.
M·V2.
Table of kinetic relations
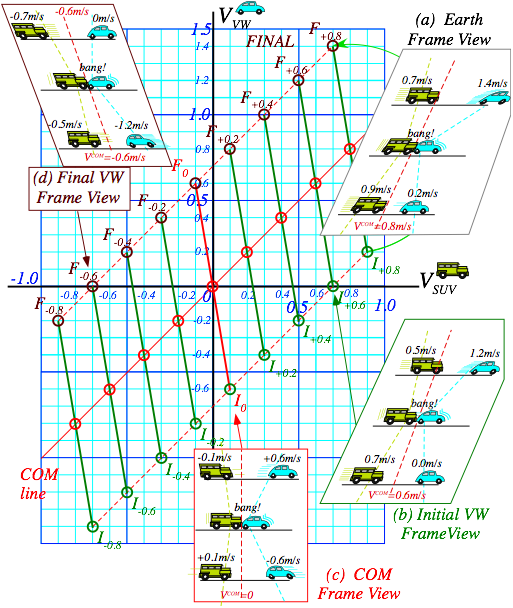
Fig. 3.3 Various Galilean Frame Views of collision in Fig. 3.1. (a) Earth frame view
(b) Initial VW frame (VW initially fixed) (c) COM frame view (d) Final VW frame (VW ends up fixed)
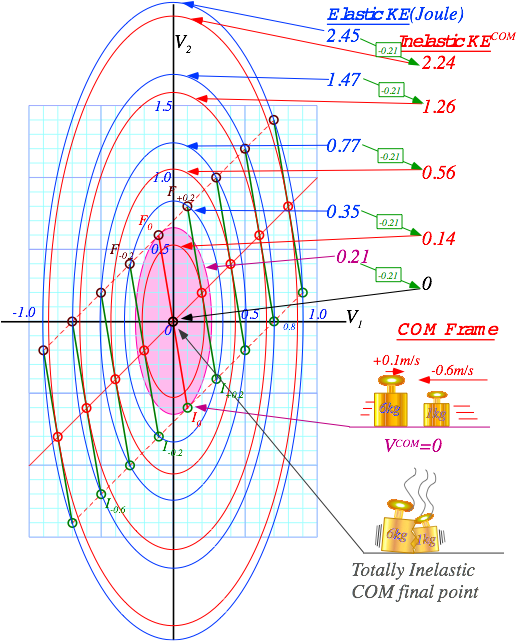 Fig. 3.4 Momentum (P=const.)-lines and energy (KE=const.)-ellipses for Fig. 3.3.
Exercise 1.3.1
Plot a (VSUV-1,VSUV-2)=(60,10) collision like Fig. 3.1 but with an identical M=4 SUV replacing the VW.
Graph paper facilitates construction of energy ellipses given the two radii a and b in (3.7). The first step is to draw concentric circles of radius a and b. Then any radial line OBA “points” to a point E on the ellipse.
Ellipse point E lies at the intersection of a vertical line AE thru radial intersection A with circle a and a horizontal line BE thru radial intersection B with circle b.
Graph grid “finds” E for a radius OBA, no need to draw AE or BE. You can pick x and find y or vice-versa.
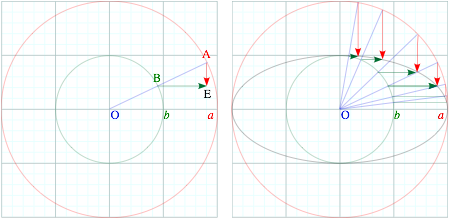
Exercise Fig. 3.4 Ellipse construction
Ellipse coordinates (xE=a·cos σ, yE=b·sin s) are rescaled base and altitude (xr=r·cos s, yr=r·sin s) of Fig. 1.4.
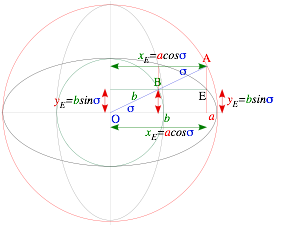
Exercise Fig. 3.5 Analytic ellipse geometry
Verify that the values (x =a·cos s, y=b·sin s) satisfy an ellipse equation (3.7b).
A dual or complimentary (gray) ellipse results if compliment angle sc=p/2-s is used so x and y values switch.
Mechanics gets difficult for many collisions, dimensions, or masses. A single one-dimensional two-mass (1D-2-body) collision occupies Ch. 2-3. Now we do more dangerous things such as an X2-super bouncer from Project Ball, our 1969 class project. (Am. J. Phys. 39, 656 (1971)) See the product liability disclaimer in Fig. 4.1.

Fig. 4.1 The X2-pen launcher with product liability disclaimer.
At first, the X2 looks like a 1D-2-body device. A superball(©™Whammo Corp.) of mass M1 =70gm launches a ballpoint pen of mass M2 =10gm. But, it has a 3rd body, bounce plate mass-MO=10kg shown by a rectangle in Fig. 4.1. Actually the third body most responsible for this experiment is good old Mother Earth of mass![]() . (Earth mass
. (Earth mass![]() and solar mass
and solar mass![]() are good-to-2-figure numbers to remember. More precisely:
are good-to-2-figure numbers to remember. More precisely: ![]() and
and ![]() .)
.)
Collisions of very large with very small masses beg thorny questions (Like, “What IS mass?” or how do we deal with it?) As a mass ratio M1/ M2 approaches zero or infinity the slope of the P-conservation line in (V1,V2)-space (Recall Fig. 3.2.) approaches infinity or zero, respectively, as drawn in Fig. 4.2(a-b).
Geometric construction in Fig. 4.2a of final velocity for an elastic collision is a vertical reflection thru the COM point (V1=V2) on the P-line if M1>> M2 or else a horizontal reflection in Fig. 4.2b if M1<< M2. Inelastic final points approach the COM point more closely if inelasticity is significant. (Recall Fig. 3.2.)
You should understand how a relatively large mass may give huge momentum to a smaller one but transfer only tiny amounts of energy. Each P-line in Fig. 4.2 is part of a KE-ellipse. In the COM frame (where the COM point is at origin) the P-line sits on top of an entire E-ellipse as the ratio M1/ M2 approaches (a) infinity or (b) zero. I visualize COM P-lines as ultra-thin ellipses between I0 and F0 and other P-lines in Fig. 4.2 as segments of a KE-ellipse that has (a) a huge V2-axis ![]() or (b) a huge V1-axis
or (b) a huge V1-axis ![]() .
.

Fig. 4.2 Extreme mass-ratio collisions (a) M1/ M2 approaches infinity. (b) M1/ M2 approaches zero.
Fig. 4.2a reflects our common experience of a bouncy ball of mass M2 hitting the Earth of mass ![]() with velocity –V0(point I0) and being reflected with velocity +V0(point F0). While standing in the Earth frame, one is very nearly in the COM frame, too. Earth’s COM velocity is a tiny fraction
with velocity –V0(point I0) and being reflected with velocity +V0(point F0). While standing in the Earth frame, one is very nearly in the COM frame, too. Earth’s COM velocity is a tiny fraction ![]() of the apparent ball velocity V0. For super-balls of mass M2=60gm, the fraction
of the apparent ball velocity V0. For super-balls of mass M2=60gm, the fraction ![]() is 0.06/(6·1024)=10-26.
is 0.06/(6·1024)=10-26.
Bounce momentum absorbed by Earth is 2 M2V0 (or M2V0 if the ball goes “Ka-runch!”) but Earth absorbs at most a tiny KE of ![]() , that is, a fraction 10-26 of ball KE:
, that is, a fraction 10-26 of ball KE: ![]() . Moreover, for elastic collisions, Mother Earth returns all the KE to M2 but she absorbs double momentum P=2M2V0.
. Moreover, for elastic collisions, Mother Earth returns all the KE to M2 but she absorbs double momentum P=2M2V0.
However, common experience does not prepare us for X2 easily rebounding M2 with more than twice its drop velocity in Fig. 4.3. (As we’ll see that means M2 rises to more than four times its drop height!)
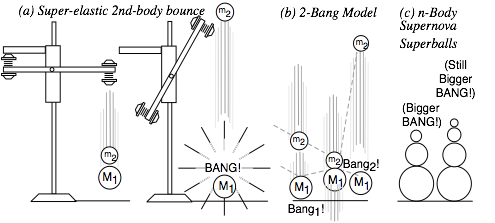
Fig. 4.3 n-Body collision experiments. (a) X-2 drop. (b) Independent collision model. (c) Ball towers.
To compute final velocities of M1 and M2 it helps to idealize the collision of three bodies M1, M2, and ![]() as a sequence of two separate 2-body collisions that are completely determined by P and KE conservation. First M1 bounces off Earth
as a sequence of two separate 2-body collisions that are completely determined by P and KE conservation. First M1 bounces off Earth![]() . Only then does M1 knock M2 to a faster speed as in Fig. 4.3b. The first collision is labeled Bang-1(01) in Fig. 4.4a followed by Bang-2(12) in Fig. 4.4b. The first Bang-1(01) between Earth
. Only then does M1 knock M2 to a faster speed as in Fig. 4.3b. The first collision is labeled Bang-1(01) in Fig. 4.4a followed by Bang-2(12) in Fig. 4.4b. The first Bang-1(01) between Earth![]() and M1 has a horizontal line like the I0F0 line in Fig. 4.2b. The second Bang-2(12) between mass M1 and M2 has a line of slope -M1/ M2 =-7 for a M1 =70gm and M2 =10gm (that of a superball and pen, respectively). The Bang-2(12) line is like the IF line in Fig. 3.1 or Fig. 3.2.
and M1 has a horizontal line like the I0F0 line in Fig. 4.2b. The second Bang-2(12) between mass M1 and M2 has a line of slope -M1/ M2 =-7 for a M1 =70gm and M2 =10gm (that of a superball and pen, respectively). The Bang-2(12) line is like the IF line in Fig. 3.1 or Fig. 3.2.
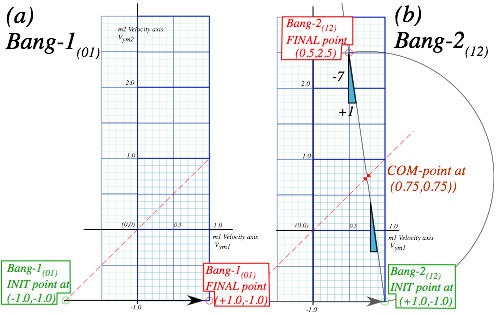
Fig. 4.4 (V1-V2)-plot of 2-Bang collision. (a) M1 bounces off floor. (b) M1 hits M2 head-on.
This approximation is called an independent collision model (ICM) and is one secret to analyzing such 1D-3-body bang-up that otherwise has one too many unknown velocities to be found by just two equations ΔP=0 and ΔKE=0 alone. ICM is exactly true if we initially separate M1 and M2 so three M1, M2, and ![]() never collectively bargain for available momentum and energy. ICM also applies to n-ball towers in Fig. 4.3c. They give very high-energy ejections and serve as classical models for supernovae. (N-body bangs are in Ch.8.)
never collectively bargain for available momentum and energy. ICM also applies to n-ball towers in Fig. 4.3c. They give very high-energy ejections and serve as classical models for supernovae. (N-body bangs are in Ch.8.)
Velocity geometry suggests a family of X2 solutions as shown in Fig. 4.5 for a range of mass ratio M1/M2. This is an advantage of geometric solutions. Just a few points in Fig. 4.5a show all elastic (V1-V2) points lie on the 45°-line CPL. Extreme or optimal cases are located in Fig. 4.5b.
First, the upper limit for elastic final velocity is V2=3·V0 at pt-I for infinite mass ratio M1/M2![]() . If no energy is lost, a particle of dust on a superball could be ejected three times the speed that the ball hits the floor. (And, it could go nine (9=32) times the drop height. However, the elastic ICM model is not so good for tiny M2 due to molecular and static charge. So bouncing balls do not usually embed dust in ceilings!)
. If no energy is lost, a particle of dust on a superball could be ejected three times the speed that the ball hits the floor. (And, it could go nine (9=32) times the drop height. However, the elastic ICM model is not so good for tiny M2 due to molecular and static charge. So bouncing balls do not usually embed dust in ceilings!)
Second, an optimal performance case is shown by pt-M where the collision achieves a 100% transfer of energy to projectile M2. The M-point is the intersection of the CPL line with the V2-axis on which the M1-ball velocity is zero. (V1=0) There mass ratio is M1/M2=3.0, the slope of the M-line.
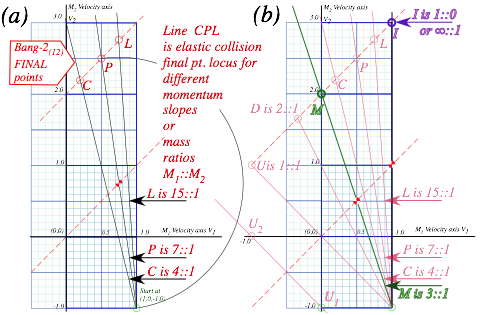
Fig. 4.5 X2-Final (V1,V2) (a) Final point locus. (b) Infinite ratio pt. I and maximum transfer pt. M.
Another singular point U is for unit ratio M1/M2=1, a familiar ratio for players of billiards or pool. U undergoes inversion of velocities (+1,-1)-> (-1,+1). (Its COM point lies at origin.) If the U-line is boosted by (-1) to (0,-2)-> (-2,0) it is like a straight elastic pool shot. A 100% of KE transfers from a moving ball to an equal sized ball that was stationary. The same process at half that speed is (0,-1)-> (-1,0) shown by the Galileo-shifted line U1-> U2 in the lower left hand side of Fig. 4.5b.
Points D between U and M have ball M1 knocked to negative velocity by the down-coming M2. Then M1 hits the floor (Earth) at velocity –v to rebound at +v. For unit ratio case U, M1 and M2 rebound quite like a rigid body. Below U, ball M1 rebounds at a speed faster than M2 to hit M2 again. In cases of low mass ratio, (M1/M2<<1)mass M1 must hit M2 many times to turn it around. We will study this effect shortly.
It is important to see how velocity values of Fig. 4.4b are turned into space-time position plot lines. Consider the first collision (Bang-1(10)) in Fig. 4.6a and corresponding space-time paths in Fig. 4.6b.
Initial velocity Vy1(0)=-1.0 gives a slope (distance)/(time) of an M1 path but doesn’t tell where is the path or particle. The same for velocity Vy2(0)=-1 of M2 in Fig. 4.6a. The paths need location, location,…
Initial position values such as (y1(0)=1, y2(0)=3) locate the paths as shown in Fig. 4.6b. Each path keeps its slope until a collision (Bang-1(10)) between M1 and the floor occurs at y1(t=1) where its path and the floor intersect. Then, according to Fig. 4.6a, M1 bounces its slope from Vy1=-1 up to Vy1=+1. Meanwhile, the upper path (M2) maintains its down slope of Vy2=-1 until it intersects the rising path of M1.
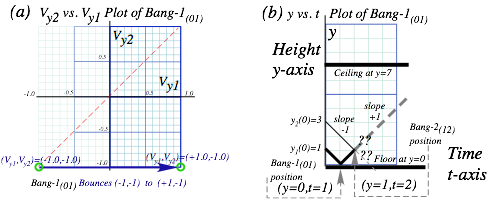
Fig. 4.6 Plots of 1st collision (Bang-1(10)). (a) Velocity-velocity plot. (b) Space-time plot.
At time (t=2) there is an intersection of paths and the 2nd collision (Bang-2(12)) between M1 and M2 at space-time point (y1(2)=1, y2(2)=3). This gives Vy1=0.5 and Vy2=2.5 in Fig. 4.4b or in Fig. 4.7a-b below. Then to keep M2 from flying away we install an elastic ceiling at y=7.
The game becomes more interesting as Bang-3(20) between the ceiling (part of Earth MO) is shown in Fig. 4.7b by a vertical arrow (like an IF line in Fig. 4.2a) reflectingM2 to speed Vy2=-2.5. Then M2 has Bang-4(12) between M1 and itself that sends it back to the ceiling at a blistering speed of Vy2=+2.7 as M1 returns more slowly toward the floor with velocity Vy1=-0.5.
The high speed of M2 lets it go to the ceiling for Bang-5(20) and return to knock M1down once more (Bang-6(12)) before M1hits the floor at Vy1=-0.9. (Bang-7(10)) Then M2 having lost speed to Vy2=+1.5 hits the ceiling (Bang-8(02)) and returns for Bang-9(12) with M1rising at Vy1=+0.9.
Masses are treated as point-masses that travel along straight lines between collisions in space-time plots. This is an ideal gravity-free ICM approximation with only straight lines in VV-plots. So we may derive motion without having to integrate the kinetic equations at the end of Ch. 3.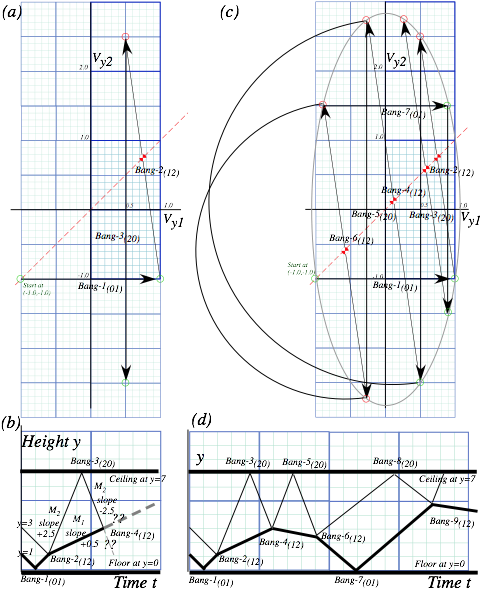
Fig. 4.7 Collision sequence. (a-b) Up to Bang-4(12). (c-d) Up to Bang-9(12).
For comparison, a force-law simulation using BounceIt of the bang sequence of Fig. 4.7 is shown in Fig. 4.8. It assumes balls instead of ideal point particles yet compares quite well. (So far.)
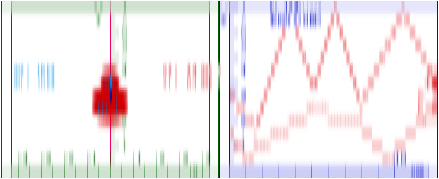
Fig. 4.8 BounceIt simulation up to Bang-9(12)in space-time plot.
Bang sequences can be very sensitive to ceiling height and initial ball values. In fact, we see examples of extreme sensitivity to initial values and parameters. Often this leads to classical chaos in which every slip in accuracy may grow exponentially so that the classical mechanics loses its ability to predict.
Running BounceIt simulation of the 1:7 system for 69 steps fills up the V-V screen with dots that forms an oval as shown in Fig. 4.9. Among other things, it shows conservation of energy in the form of the KE ellipse (3.7). Bang P-lines (IF-lines) in Fig. 4.7b must terminate on a KE-ellipse of energy as shown.
![]()
The major and minor radii are ![]() and
and ![]() and this checks with Fig. 4.9. The IF-line geometry provides a strange way to construct an ellipse. Later this geometry shows some deep relations between velocity, momentum and energy.
and this checks with Fig. 4.9. The IF-line geometry provides a strange way to construct an ellipse. Later this geometry shows some deep relations between velocity, momentum and energy.
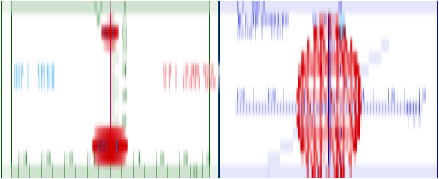
Fig. 4.9 BounceIt simulation up to Bang-69(12)in velocity-velocity plot.
Balance equation (3.4) concisely sums up preceding constructions or plots of elastic collisions.
![]() or:
or:![]() (3.4)repeated
(3.4)repeated
More concise notation uses vector equations or arrays.
![]() (4.1)
(4.1)
It saves writing two (=)’s and two (-)’s. Also, each column vector may be labeled by a “fat” letter.
![]() (4.2)
(4.2)
Each fat-letter stands for an arrow vector in Fig. 4.10. The Gibbs vector form of equation (3.4) or (4.1) uses fat-v or over-arrow-![]() .
.
v = 2 VCOM – v , or: ![]() . (4.3)
. (4.3)
Algebra and geometry are helped by fat-v (vector) notation. Fig. 4.10 shows how vector VCOM is half the vector-sum v+ vFI of IN velocity v and FIN velocity vFI. (Since this is an elastic collision, the labels IN and FIN may be switched.) VCOM lies on a (vI+ vFI)-parallelogram diagonal. The opposite diagonal (dashed M1/M2 line) bisects (vI+vFI) to give VCOM=(vI+ vFI)/2.
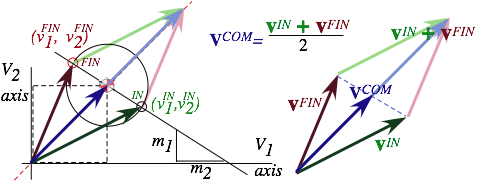
Fig. 4.10 Vector collision velocity diagrams (After equation (4.1).)
Note the distinction between vectors v=(v1, v2) above for two particles each in one-dimension and more common vectors v=(vx, vy) (or v=(vx, vy, vz)) for one particle in two-dimensions (or three dimensions).
Fig. 4.11 shows how vectors help analyze the results of Bang-1(01) and Bang-2(12) collisions done before in Fig. 4.7. What’s new is a space-space y2 vs. y1 or position-vector y-plot whose paths are called spatial-trajectories or just plain trajectories. They are made like the space-time paths in Fig. 4.7 by transferring velocity slopes over to the space plot, but vectors in Fig. 4.11 simplify this geometry.
As the construction steps in Fig. 4.11 show, one easily transfers each velocity vector v(n) from the V2 vs.V1 plot so it points away from start point y(n) in the y2 vs. y1 plot. Step-0 does this by drawing initial velocity v(0)=(-1,-1) to point away from our given initial position y(0)=(1,3). Then you extend that v-vector until it hits the floor (as v(0) does at y(1)=(0,2).), or hits the collision line (y2=y1) (as v(1) does at y(2)=(1,1).), or hits the ceiling (as v(2) does at y(3)=(2.2,7).). Each such “hit” is a Bang, Bang-1(01) at y(1), Bang-2(12) at y(2), or Bang-3(20) at y(3). Then from each Bang-n position point y(n) is drawn the next v(n)-velocity vector from the V2 vs.V1 plots. This process continues in Fig. 4.12.
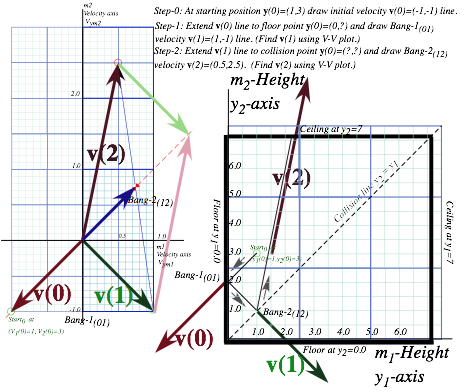
Fig. 4.11 Vector collision velocity diagrams with Velocity-Velocity space and space-space.
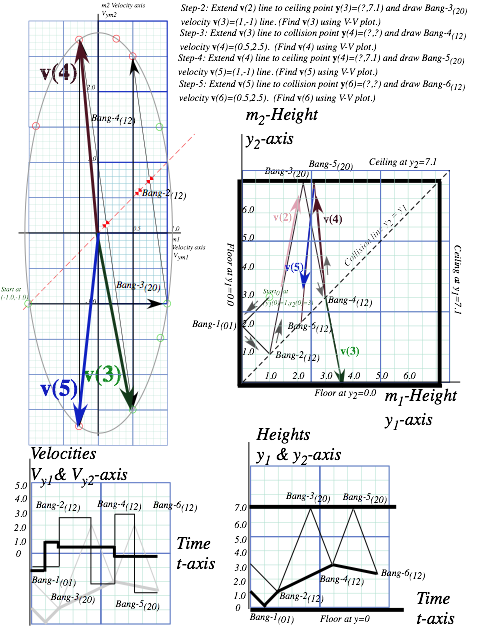
Fig. 4.12 Vector collision diagrams continued with velocity-time and space-time plots added.
Some remarks about space-space plots are in order. First, position y(n)-vectors of the Bang-n points are not drawn in Fig. 4.12 to avoid clutter. Also, ideal (small) masses called point masses are assumed.
The trajectory in these figures is confined to the triangle above the 45°-collision line. Our model keeps m2 above m1. The right-hand “ceiling” in the figures never is hit because m1 always is knocked down by m2 before it touches the ceiling, and m2 never sees the floor because m1 is in the way. (Quantum theory doesn’t encourage this feature. Quantum objects pass easily through each other! )
For ball-Earth collisions involving ceiling or floor, the paths bounce in the space-space plot as though they’re inside a box. Only one component V1 or V2 changes each time and only by changing ±sign. Off the floor: (V1 ,V2) changes to (-V1,V2) , off of ceiling: (V1,V2) changes to (V1,-V2). It is like a single particle bouncing around a pool table. Here (V1,V2) acts like (VX ,VY) in two dimensions, so two particles in one-dimension use graphs similar to one particle in two dimensions, a useful analogy in quantum theory.
When paths bounce off the floor and ceiling in the space-space plot, the angle of incidence equals the angle of reflection just as light rays reflect off mirrors. (Newton imagined little light corpuscles bouncing around.) It is customary to measure path angles from the normal or perpendicular to a mirror so a normal bisects the angle between the incident and reflected paths.
For m1-m2 Bangs off the 45°-collision line, the bisecting line has the slope -M1/M2=-7. It is like having mirror facets at slope M2/M1=1/7 along the 45°-collision line. For equal-mass-(M1=M=M2) balls, or one ball in two dimensions, the bisecting line slope at the 45°-collision line is –1 or -45° and the collision line acts like a unit-slope mirror on a triangular billiard table. It is not quite that simple if![]() .
.
Consider the two collisions Bang-3(20) and Bang-4(12) in Fig. 4.12. Velocity v(2) bounces off the ceiling in Bang-3(20) into v(3), whose velocity slope is close to the mass-ratio M1/M2 which is 7:1 here. So the next collision Bang-4(12) bounces v(3) off the diagonal into v(4) which is close to –v(3). It’s followed by another ceiling bounce Bang-5(20) into v(5) heading down for another collision Bang-6(12).
Lower Fig. 4.12 has a velocity vs. time plot next to a space-time plot. (A y-t plot in gray is under the V-t plot, too.) Each Bang means a change in velocity for any particle involved in the collision. By Newton’s 2nd law (3.10c) each change in velocity, v to v+Dv, or better, each change in momentum, mv to m(v+Dv), requires a force impulse F·Dt= m(Dv) on each mass that changes. Shortly, we study ways to deal with this F.
The velocity-velocity (v1,v2) plots, such as the left side of Fig. 4.12, fall in a category known as kinematics, or momentum analysis, which is concerned with how things are going, where they’re headed, or what is their velocity or momentum and energy. (kinos means movement.)
In contrast, the space-time plots, such as the right side of Fig. 4.12, fall in a category known as dynamics, or coordinate analysis, which is concerned with how things are located, where they are, or what are their coordinate or position and time schedules. (dynos means change.) We introduced the space-space (x1,x2) plot, another geometric or trajectory representation of dynamics.
Before going on, let’s compare how kinos and dynos play out in classical Newtonian physics versus their corresponding roles in quantum physics. This is a preview for later Unit 4, Unit 7, and Unit 8.
In Newtonian physics, a precise position plot (yk vs. time) lets you find a precise velocity plot, too, and, a velocity plot (Vk vs. time) lets you find a position plot if you know starting position values. (We did just that in Fig. 4.7 and Fig. 4.12.) In calculus, finding position from velocity values is called integration, and finding velocity from position values is called differentiation. Of the two, the latter is formally easier but numerically more sensitive and error prone.
In quantum physics, having a precise velocity plot renders a position plot meaningless and vice-versa! Werner Heisenberg was the first to state this quantum idea, now known as Heisenberg’s Principle. If you know momentum exactly, that means a uniform wave is everywhere, and all positions are equally possible. If you know position exactly, that means every momentum is possible, implying a “wave-bomb” about to blow up the universe! (Fortunately, neither of these extremes readily exist.)
All this sounds crazy to most of us who are born-and-bred Aristotelean-to-Newtonian students. It is difficult enough to go from Aristotle’s what-you-see-is-what-you-get (WYSIWYG) universe to Newton’s corpuscular one. A quantum universe is yet another step removed on the WYSIWYG scale.
A way to see the quantum universe (Perhaps, it is the way.) is to learn about wave kinematics and dynamics without Newtonian corpuscles and see how waves mimic corpuscles and do so quite cleverly. The quantum universe is a WYDAWYG (waves-you-don’t see-are-what-you-get) world!
So our plan is to cast classical Newtonian kinematics and dynamics in a form that carries over into vibration and wave kinematics and dynamics. It is done by analogy with classical waves such as sound waves, water waves, and (most important) light waves. Many classical wave analyses invoke corpuscles (including, for Newton, light waves) so these analogies, like any analogy, need critical use of an Occam’s razor that must be sharp. Above all, symmetry principles must be taken seriously.
Exercise 1.4.1: Construct a history of a 4:1 mass ratio bounce. x1(0)=1.5, x2(0)=3.0, v1(0)=-1, v2(0)=-1
Ceiling height=7.0.(For bottom row: Ceiling height=6.0 ) The 4:1 mass ratio case is surprisingly periodic.
Exercise 1.4.2: Complete Fig. 4.12 two more steps. Ceiling height=3.0.
Where would “gameover” point be if floor was open after Bang-1?.
Analysis of many collisions with very different masses requires an advanced kind of geometry and algebra involving matrices and symmetry operators. Similar analysis is needed for quantum theory so this is a good opportunity to learn about these concepts using a classical bang physics that is quite clear-cut.
Fig. 5.1 shows a big mass m2=49 bang a little mass m2=1 more than ten times off the ceiling before being halted. This tests our collision precision! To check our results we use our previous vector equation (4.1) to make a matrix equation in (5.1) with ![]() and total mass M = m1+ m2.
and total mass M = m1+ m2.
![]() (4.1)repeated
(4.1)repeated  (5.1a)
(Let ![]() and
and![]() here.) Vector equation (5.1a) is converted to matrix equation
here.) Vector equation (5.1a) is converted to matrix equation ![]() in (5.1b).
in (5.1b).
![]() (5.1b)
(5.1b)
Each IN-to-FIN bang is a ![]() operation (5.2a). Matrix product
operation (5.2a). Matrix product ![]() (5.4b) is bang-M following bang-N.
(5.4b) is bang-M following bang-N.
![]() (5.2a)
(5.2a) ![]() (5.2b)
(5.2b)
Matrix M operates column-by-column on another matrix N as it does on a vector v. The off-the-ceiling matrix C =![]() changes (v1, v2) to (v1, -v2) (Odd-n Bang-n(02)) A 2-ball collision matrix M (Even-n Bang-n(12)) and ceiling bang C act p-times in matrix products
changes (v1, v2) to (v1, -v2) (Odd-n Bang-n(02)) A 2-ball collision matrix M (Even-n Bang-n(12)) and ceiling bang C act p-times in matrix products ![]() to give Fig. 5.1.
to give Fig. 5.1.
![]() (5.3)
(5.3)
(5.4) shows (p=5) double-bangs ![]() following a floor-bounce
following a floor-bounce ![]() or 11 bangs in all.
or 11 bangs in all.
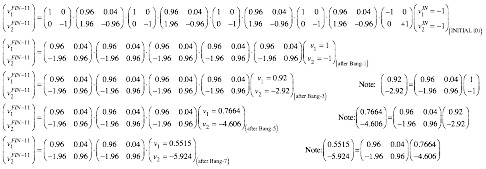 (5.4)
(5.4)
![]() Even after 9 bangs, big m1 still has a small upward velocity v1=0.2925.
Even after 9 bangs, big m1 still has a small upward velocity v1=0.2925.
After Bang-11(02) big m1 is nearly stopped and little m2 is coming down at v2=-7.071 with all the energy!
![]() (5.5)
(5.5)
Look out below! As m1turns back it crosses v1=0 axis in Fig. 5.1a. The greatest curvature (acceleration or force) for m1 is between Bang-8 and Bang-14 in Fig. 5.1b just when m2 is busiest. Geometry works, too!
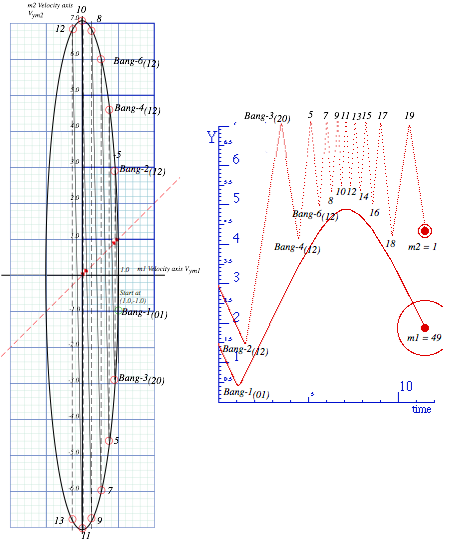
Fig. 5.1 Multiple Bangs of the m1=49 and m2=1 superball system. (a) V vsV plot. (b) Y vstime.
Big m1 descends rapidly after being pushed down by m2 hits. Soon hits by an exhausted m2 become less frequent. At some point m2 ends up slower than m1 and can’t hit it again. With no floor both would fall below y=0 with no further bangs. (We’ll call this a game-over point. As an exercise, you should find it.)
However, if a floor intervenes, then a 2nd floor-bounce matrix F=![]() changes (v1, v2) to (-v1, v2) and bounces ball-m1 back up to start the whole process over again. Ball-m1 does another graceful up-then-down time trajectory very much like the one shown on the right-hand side of Fig. 5.1.
changes (v1, v2) to (-v1, v2) and bounces ball-m1 back up to start the whole process over again. Ball-m1 does another graceful up-then-down time trajectory very much like the one shown on the right-hand side of Fig. 5.1.
Except for floor bounces, the m1-ball in Fig. 5.1 experiences smoother flight than in Fig. 4.12 where a more massive m2-ball jerks it severely. A smaller mass m2 has less momentum-per-bang. The result is a gentler and smoother force cushion for m1. Force and potential field theory will be derived from this.
Here is an example of geometry and slope ratios being helpful. If you view the ellipse in Fig. 5.1a lower-edge-on (and do the exercise to finish it!) you may see it as a circular clock with each double-bang (odd-bangs 1,3,5,…) rotating the v-vector like a clock hand ticking equal-angle jumps around a dial.
You can make an energy ellipse (2E=m1v12+ m2v22) like Fig. 5.1(a) sketched in Fig. 5.2(a) into an energy circle (2E =V12+V22) like Fig. 5.2(b) by rescaling velocity (v1, v2) to (V1 = v1·√m1, V2 = v2·√m2).
V1=v1·√m1, V2=v2·√m2 where: 2E=m1v12+ m2v22=V12+V22 (5.6)
Big-V variables replace little-v’s by setting (v1 =V1/√m1, v2 =V2/√m2) in matrix relation (5.1).
![]() (5.1)repeated
(5.1)repeated ![]() (5.7)
(5.7)
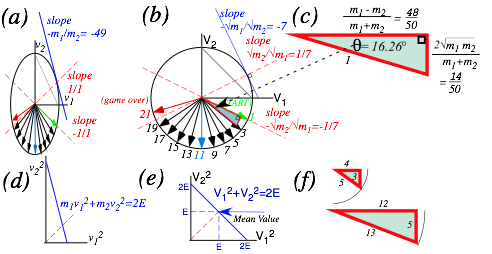
Fig. 5.2 Velocity-velocity clocks. (a) Energy ellipse (As in Fig. 5.1) (b-c) Energy bang-clock angles
(d) Velocity-squared E-plot. (e) Mass-scaled V-squared E-plot. (f) Integral right triangles
Clearing scale factors √mk gives the following big-V matrix relations to replace (5.1) above.
![]() (5.8)
(5.8) ![]() (5.9)
(5.9)
The trick is to notice a Pythagorean relation x2+y2=1 for the circular bang-matrix components.
![]() (5.10a)
(5.10a)
The matrix can be defined using sinq and cosq shown for m1=49 and m2=1 and angle q =16.26° in Fig. 5.2(c).
![]() (5.10b)
(5.10b)
A 1-Bang matrix is a reflection by q. Our 2-Bang matrix is a rotation by angle -q =-16.26° in big-V space.
![]() (5.11)
(5.11) ![]() (5.12)
(5.12)
(5.12) is a big help in N-double-bang calculations like (5.4). Instead of multiplying the matrix (5.9) by itself N-times, we just replace q =16.26° in (5.12) by Nq =81.30° (for N=5) and get answers in (5.13) below pronto!
![]() (5.13a)
(5.13a)
Relating V’s to v’s by (V1=v1√m1, V2=v2√m2) gives (5.1b). Here ![]() is after floor F gives (v1, v2)=(1,-1).
is after floor F gives (v1, v2)=(1,-1).
 (5.13b)
Without a 2nd floor-bounce-back operation F, this sequence ends near bang-21 our “game-over” point. (How? Do the exercise!) Matrices analyze collision sequences clearly so that you can “engineer” them.
If two balls of mass m2=1 and m1=7 bounce back and forth between wall the small ball goes faster on the average than the bigger one. How much faster? Let’s assume that arrows on the scaled velocity clock in Fig. 5.2(b) get uniformly distributed around its circle after many collisions. (Fig. 5.2(b) shows only m1-m2-bounce arrows. m2-ceiling-bounce-arrows fill up the upper half.) A ball’s velocity and momentum must sum and average to zero otherwise it will not stay in the region between the floor and the ceiling.
But, what is average squared-velocity v2 of each ball? An energy plot in the space (V1)2 vs (V2)2 of scaled velocity-squared helps to answer this. The result is a 45° line shown in Fig. 5.2(e). In other words points on the circle in Fig. 5.2(b) get mapped onto the 45° line in Fig. 5.2(e) by KE conservation.
(V1)2 + (V2)2 = 2 KE = m1(v1)2 + m2(v2)2
The average of all points on the 45° line is its bisector.
(V1)2 = KE = (V2)2 or: m1(v1)2 = KE = m2(v2)2
This gives the average velocities or root-mean-square-speeds v1rms and v1rms of m1 and m2.
![]()
![]() (5.14)
(5.14)
Each ball, regardless of mass, gets equal share (50% if there are just two) of the total energy. So, if m1 is 7 times m2 then the mean speed of m2 is √7=2.65 times faster than that of m1. The 1st bang in Fig. 4.4 gives 2.5.
Geometry often offers interesting numerics. In this case, the general right triangle in Fig. 5.2(c) makes integer or rational fraction solutions to the Pythagorean sum a2+b2=c2 such as the famous (a=3,b=4,c=5) right triangle. Perfect-square mass values (m1 and m2=1, 4, 9, 16, 25, 36, 49, 81, 100,…) will give integral valued right triangle altitude a=√(4 m1·m2), base m1-m2, and hypotenuse m1+m2. Examples in Fig. 5.2 are (a=14,b=48,c=50) for (m1=49, m2=1) and (a=12,b=5,c=13) for (m1=9, m2=4).
In 1843 Hamilton discovered his quaternion algebra {1,i,j,k}, a mathematical jewel. In 1930 Pauli found related spinor matrices {1,sX, sY, sZ}. We label Pauli matrix sZ as sigma-A=sA (A for Asymmetric) and sX as sigma-B=sB (B for Balanced). They are Hamilton’s k and i with an imaginary factor ![]() attached.
attached.
Other matrices, sigma-C=sC (C for Circular) and sigma-0=s0(0 for “Origin”) are products like sAsB or sA2.
![]() (5.15c)
(5.15c) ![]() (5.15d)
(5.15d)
Hamilton’s {i,j,k} square to -1. (i2=j2=k2=-1) That is like ![]() . But, Pauli-s’s square to +1. (1=sX2=sY2=sZ2.)
. But, Pauli-s’s square to +1. (1=sX2=sY2=sZ2.)
We now relate s-matrices to simple super-ball collision reflections and rotations shown in Fig. 5.2. For example, the sA is our “ceiling bounce” C in (5.3) and our “floor bounce” F in (5.3) is just - sA.
![]() = C (5.15a)
= C (5.15a) ![]() = F (5.15b)
= F (5.15b)
A geometric view of sA (or - sA) is mirror reflection thru Cartesian x-(or y) axes in Fig. 5.3a while sB (or - sB) is reflection thru mirror planes tilted at angle p/4 (or -p/4) between x-y axes in Fig. 5.3b. General reflection sf thru a mirror plane tilted at angle f/2 (Fig. 5.3c) is a sum (5.15c) of sA cosf and sB sinf. We now verify this.
![]() (5.15c)
(5.15c)
Like all reflections, sf must square-to-one. (sf2=1) It does so because sA2=1=sB2 and sAsB =-sBsA.
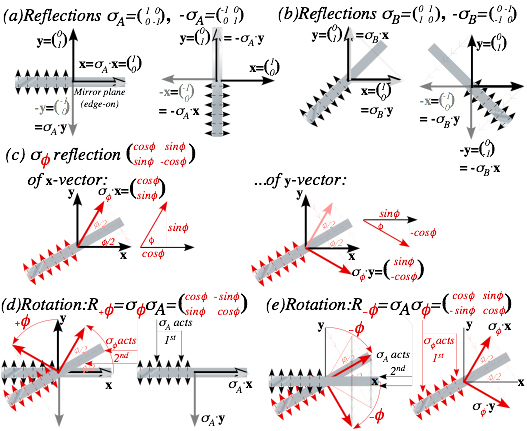
Fig. 5.3 Mirror-reflection geometry (a)±sA, (b) ±sB, (c) sφ. Right-and-left-handed rotation (e) sφsA (f) sAsφ.
We test sf on unit vectors![]() and
and ![]() and see that matrix algebra checks with geometry in Fig.5.3c.
and see that matrix algebra checks with geometry in Fig.5.3c.
Geometry Fig. 5.3d also shows that a product s2s1 of any two reflection matrices is a rotation matrix R.
In Fig. 5.3d sfsA is right-hand rotation R+f but sAsf=R-f in Fig. 5.3e is left-handed. Rotation angle f is twice the angle f/2 between mirrors. Direction of rotation s2s1 is from 1st mirror (of s1) to 2nd mirror (of s2).
For example, rotation sBsA is by +90° and sAsB is by -90°. Rotation sA(-sA)=(-sA) sA is by ±180°.
The rotation in V1 vs V2 space of Fig. 5.2b is a product of ceiling bounce and m1-m2 collision that are each a reflection. An even simpler example of paired-reflection rotation is a clothing store mirror in Fig. 5.4a. It lets you swing two mirrors like doors to view multiple images of yourself. If you set the angle between mirrors to f/2=30° as in Fig. 5.3 d-e or to 60° as in Fig. 5.4a then you see yourself rotated by twice that angle. Images are turned 120° counter-clockwise in the right mirror and clockwise (-120°) in the left mirror of the latter.
The sketches in Fig. 5.4a oversimplify the actual images shown by photos of a real mirror pair. The single reflections for sA are not shown in the sketch but clearly visible in photos where the sA and sf images both have backwards text and a left hand image of the original right hand. This is corrected in the (-120°)-rotated sAsf image and the (+120°)-rotated sfsA image.
A special case is rotation sA(-sA)=(-sA) sA by ±180° due to setting mirrors at exactly f/2=90° as in Fig. 5.4b. The result is known as a corner-reflector image. Wherever you stand while viewing a 90° corner you see your image centered and rotated±180° to face you but it is not reflected. A 90° corner image is as others see you, complete with a readable monogram on your jacket and your right hand on the right side.
A product of two reflections is a rotation Rf=s2s1, but two rotations just give another rotation Rf+q= RfRq and never a reflection. This makes reflections more basic and productive than rotations.
On the other hand, you cannot do a reflection of a real solid object without entering an Alice-in-Wonderland looking-glass-world. Moving every atom in a classical object to a reflected position (without destroying it) is unthinkable! Yet, we easily rotate semi-solid objects (like your eyeballs while reading this).
Waves, on the other hand, are very un-solid and do reflection effortlessly. Rotation takes twice the effort as seen in the looking glass images of Fig. 5.4. This is why reflection operations are so basic to the study of wave mechanics, quantum theory, and relativistic symmetry as we will see in later Units.
Symmetry operation R or s is defined by what it does to unit vectors ![]() and
and ![]() as sf (5.16) is done in Fig. 5.3c. That matrix does that same operation to any and all vectors
as sf (5.16) is done in Fig. 5.3c. That matrix does that same operation to any and all vectors![]() in the space.
in the space.
![]() (5.18)
(5.18)
A way to distinguish rotation and reflection operators is by the determinant det|M| of their matrices.
A determinant of matrix M quantifies the space (area in this case) enclosed by vectors in M‘s rows or columns (u and v enclose a parallelogram in this case).
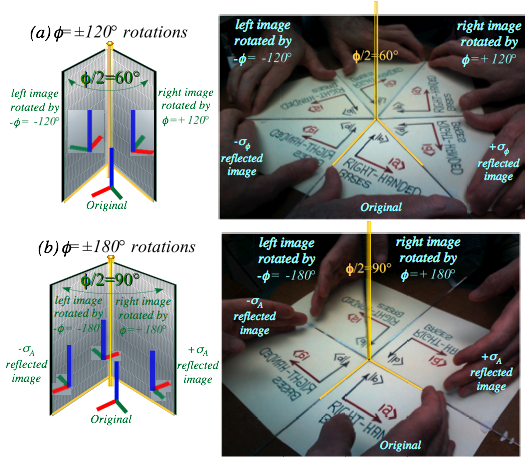
Fig. 5.4 Mirror reflections and their rotations with relative angle: (a) 60° (b) 90° (corner reflector images).
A rotation determinant is +1, but a reflection determinant is –1. Reflected area or angle in Fig. 1.3 is negative.
Determinants track the multiplication of matrices. The determinant of a product is a product of determinants.
det|M·N|= (det|M|)(det|N|)= det|N·M|
Thus, two reflections each with det|s|=-1 form a product of det|s1 s2|=(-1)(-1)=+1, that of a rotation. This also shows a product of rotations cannot make a negative-det-matrix and so cannot be a reflection.
Exercise 1.5.1 Complete Fig. 5.1 to the game-over point where sequence ends without 2nd floor bounce.
What mass-ratio close to that of Fig. 5.1 would cause the two to drop away with the same final velocity.
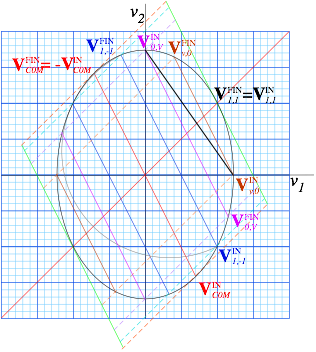
Exercise 1.5.2. Ch. 1-5 contains geometric description of 1D-2-body collisions. Most examples originate from initial velocity vectors ![]() for which m1 and m2 have equal speeds (in this case unit speed).
for which m1 and m2 have equal speeds (in this case unit speed).
This exercise is intended to help match algebra and geometry by asking for the simplest formulas for the various velocities in a figure above that are final elastic results of the following initial velocity vectors.
a. ![]() b.
b. ![]() c.
c. ![]() d.
d. ![]()
Derive the IN and FIN components of all vectors in terms of masses m1 and m2 only assuming the same total KE as ![]() has. (Check your results against figure in which ratio 2=m1/m2 holds.)
has. (Check your results against figure in which ratio 2=m1/m2 holds.)
Indicate where the time reversed vector T·VIN of each VIN lies.
Give a formula for the orange (dashed) and green (solid) tangent line slopes in terms of m1 and m2.
…and compare to slope of the black line connecting major and minor radii in terms of m1 and m2.
Analysis of force is one of the trickier parts of Newtonian mechanics and one that Aristotle seems to have not done so well. We, like Aristotle, feel we know force after being pushed and pulled around by it most of our conscious lives. Aristotle related force directly to mass and its motion. If he ever wrote equations then, perhaps, Aristotle’s equation would be F=Mv.
NOT! Mv is momentum, not force. Galileo and Newton are among the first to realize that force should be equated to a change in momentum. A famous equation F=Ma equates force to mass or inertia M times acceleration a, the rate of change of velocity. (It is called Newton’s 2nd law or NEWTON-TWO. Recall (3.10c).)
![]() (6.0)
(6.0)
Motion of m1 in Fig. 5.1b suggests a kinetic model and a potential force field. Boltzman used this to derive gas force laws for volume, temperature, and pressure. As a big m1-ball squeezes space (volume) for a tiny m2-ball in Fig. 6.1, the speed v2 and energy 1/2 m2v22 of m2 increases. So does the momentum transfer rate or bang-force on m1. Energy is related to temperature and bang-force is related to pressure. A furiously bouncing m2 is like a single-atom gas getting hot when its Y-space is compressed as in Fig. 6.1b.

Fig. 6.1 Big mass-m1 ball feeling “force-field” or “pressure” of small ball rapidly bouncing to-and-fro.
A “double-whammy” hits the m1-ball as it closes in with velocity v1 toward m2 and the ceiling:
(1) Bang rate B with m2 increases with shrinking distance 2Y traveled by m2 back-and-forth to the ceiling.
(2) Increased velocity v2 (due to v1) increases momentum m2v2 and DP transferred to m1 by each bang.
(3) Increased velocity v2 (due to v1) increases bang rate even more. It’s really a triple whammy!
If m1 is huge (say 1kg) compared to atom or molecule m2 (say (2/3)·10-27kg for an H-atom), the speed v1 of the macro-mass m1 may be negligible compared to typical atomic speeds v2 of 103 m/s. Then we ignore effects (2) and (3) due to tiny v1 in a so-called isothermal model. A better adiabatic model includes them.
Atom m2 in Fig. 6.1 travels distance 2Y back & forth between m1 and ceiling at Y for each bang m1. If v1 is slow, the time Dt between bangs is 2Y divided by velocity v2 of m2. Bang rate B is the inverse: B=1/ Dt.
Dt = 2Y /v2 (bangs per sec) (6.1a) B =1/Dt = v2 /2Y (seconds per bang) (6.1b)
Each head-on bang of big m1 on small m2 changes velocity of m2 from -v2 to +v2FIN as shown in Fig. 6.2.
(for: m1>>m2): v2FIN = v2+2v1 (»v2 for: v2>>v1) (6.2)
Added speed for m2 is 2v1, twice that of incoming m1. (SeeV-V-plot Fig. 6.2 for large-m1.) The change DP of momentum m2v2 is the difference between FIN value +m2v2FIN and IN value -m2v2.
DP = (+m2v2FIN)–(-m2v2)=2m2v2+2m2v1 (» 2m2v2 for: v2>>v1) (6.3)
So, if “atomic” velocity v2 is large compared to v1 it gives a bang-force F=B· DP = DP/Dt on m1.
BP= DP/Dt =F = 2m2v2(v2 /2Y) = m2v22/Y (6.4)
So a force field F=2·KE/Y on m1 due to m2 is proportional to KE=1/2m2v22 or temperature T of m2. Boltzman’s constant k of proportionality (KE=kT) gives an isothermal force law FY=2kT. It is a 1-D version of Boyle’s ideal gas law: PV=2kT. Here a ceiling tries to keep energy or “temperature” of m2 constant in spite of m1.
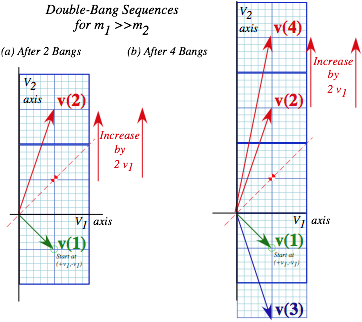
Fig. 6.2 Large mass-ratio (m1/m2>>1) bounce sequence. (Compare to Fig. 4.2a.)
An elastic ceiling can’t give or take energy so each m1 bang adds velocity 2v1 to v2 at rate B=v2 /2Y (6.1). As m1 closes at speed v1 it reduces distance 2Y that m2 travels. So bang rate B grows due to more v2 and less Y.
![]() , y =v1t=H-Y,
, y =v1t=H-Y, ![]() (6.5a)
(6.5a)
We cancel time and v1 to show this force is inverse-Y- cubed. That’s a lot “harder” than inverse-Y in (6.4).
![]() ,
, ![]() ,
, ![]() ,
, ![]() (6.5b)
(6.5b)
This is called an adiabatic or “fast” force law. Collisions are so fast that an isothermal-seeking “Robin Hood” in the ceiling hasn’t time to steal m2’s energy when it’s judged too energy-rich or give energy back when m2 becomes energy-poor. So m2 can get hotter and hit m1 harder and more often as gap Y shrinks.
Each force law (5.9) and (6.5) actually conserves the energy of the big-m1 ball in the long run. By that we mean that m1 will come out with practically the same energy that it had when it went in.
The adiabatic case is easier to see. Each bang conserves energy as demanded by the kinetic energy (KE) conservation relation (3.5a). Little-ball velocity v2=const./Y from (6.5b) is used here.
![]() =const. (6.6)
=const. (6.6)
The first term is m1’s kinetic energy KE1. The second term, which is really m2’s kinetic energy, is called m1’s potential energy PE1 or just plain PE, and it is labeled U(Y) since it varies according to height Y of m1 only.
![]() (6.7)
(6.7)
The PE is energy that m1 lends to m2 each time m1 moves a distance DY closer so m1 does a little bit of work DW on m2. Work is defined as force times distance. (DW=F·DY) Power, the rate of work done, is defined as force times velocity. Here distance is a small DY and the force F in (6.5b) is m2 const.2/Y3. But “work” force might be plus-or-minus (±)m2 const.2/Y3. Which sign? (+) or (-)? Conflicting sign conventions make force-physics confusing. The sign depends on how force and direction are defined. (It’s all relative!)
A physicist’s force Fphys is what is felt by a free object (Here that’s m1.) whose motion is driven by force field F=Fphys. A mathematician’s force Fmath is what is needed to hold back the object in the force field. (How apropos! A physicist lets it go but a constipated mathematician holds it back!) They differ by (±) sign only, that is, Fmath =-Fphys, and Fmath is the equal-but-opposite force by an object (m1 here) on its field or force agent(s) (m2 here). (This is essentially Newton’s 3rd law. (NEWTON-THREE) )
Force is momentum flow. Momentum is stuff that’s conserved, so the flow rate Fphys of this stuff into an object m1 must be balanced by an equal-but-opposite negative flow, Fmath =-Fphys, out of the forcing agent(s) (m2 here), and, vice versa, whatever flows out of m1 flows into m2. Momentum p=mv and force F are both vector quantities and a ±sign gives direction to-or-fro, another confusing (±) sign to bother us. But, whatever the flow rate Fphys seen by m1, then m2 sees the opposite rate Fmath =-Fphys.
Let’s define positive Y and F direction to be away from the ceiling in Fig. 6.1. So incoming m1 has negative velocity v1=-DY/D t , but after m1 reverses V=DY/D t is positive. Positive V=-v1 (increasing Y) and positive Fphys means both momentum and energy of m1 are being increased by force Fphys. Each bit of energy or work DW=FphysDY gained by m1 is energy lost by the force-field’s potential “bank” that is m2. (DU=- DW)
![]() (6.8)
(6.8)
In other words, power P =Fphys.V into m1 is power (- DU/D t ) out of the field. (V=DY/D t is m1‘s velocity.)
![]() (6.9)
(6.9)
But is this consistent? Does force Fphys in (6.8) really equal minus the slope of potential (6.7)? We check.
![]() (6.10)
(6.10)
Well,Yes!! Note that F=- DU/D Y needs that 1/2 on kinetic energy 1/2 m2v22. (See discussion of (3.5).)
The isothermal case is a weird one. The little “force-field agent” m2 maintains it kinetic energy at around the same initial value 1/2 m2v22 no matter how much the big mass m1 loses or gains kinetic energy.
It’s as though a “Robin-Hood” in the ceiling acts like a big Federal Reserve Bank. (“The Fed.”) Whatever energy m2 earns from m1 is taken and stored away if its over initial deposit ![]() (m2v22)=T, but if m2‘s deposits falls below that value, the Fed makes up the difference. This energy or deposit limit is determined by a prevailing allowed “temperature” of the ceiling or the current money supply. (I’m not making this up. It’s what happens in nature and very roughly what happens in our economy. It becomes a problem if the Fed stops being a Robin Hood and becomes a robbing hood!)
(m2v22)=T, but if m2‘s deposits falls below that value, the Fed makes up the difference. This energy or deposit limit is determined by a prevailing allowed “temperature” of the ceiling or the current money supply. (I’m not making this up. It’s what happens in nature and very roughly what happens in our economy. It becomes a problem if the Fed stops being a Robin Hood and becomes a robbing hood!)
Under ideal conditions, force agent m2 makes a much “softer” 1/Y force field F=m2v22/Y given by (5.9). Definition (6.9) of force F as negative-U-slope -DU/D Y then gives a logeY=lnY potential.
![]() (6.11)
(6.11)
It may seem weird that we can define a useful potential while energy-funds are being siphoned in and out. Nevertheless, the ceiling “Robin Hood” is true to his word. (Analogy with “The Fed” ends here!) He puts back all the energy that m1 gave up to m2 (the potential U) on the way in, so that, except for small-change or “tips” left with m2 after the final parting collision, m1 recovers the energy it originally had. Such a force field, if determined by such a reliable potential, is also a conservative one. We discuss later the details of what is needed for general multi-dimensional fields to be labeled “conservative.”
Consider a mass m1 between two walls and two little speeding m2 masses as in Fig. 5.5. m1 feels a force like that of an oscillator. As m1 moves distance x off center the left wall space expands to Y+x and the right wall space shrinks to Y-x. Two opposing forces (6.11) then are unbalanced. (Only x2, x4,… terms cancel.)
![]()
Here we let Y=1 be a unit interval and assume an isothermal kinetic constant ![]() for each side. For small x (x<<1) the force Ftotal has a linear or Hooke’s law form, and the potential Utotal is quadratic.
for each side. For small x (x<<1) the force Ftotal has a linear or Hooke’s law form, and the potential Utotal is quadratic.
![]()
![]() (6.12)
(6.12)
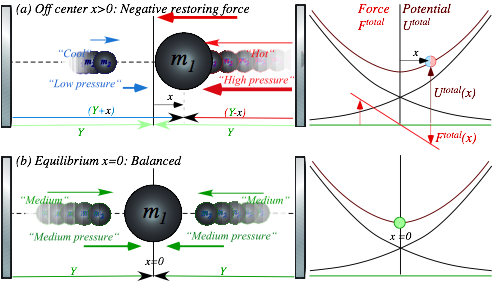
Fig. 6.3 Oscillator force and potential (a) Off center with (-)force (b) On center at equilibrium.
You should be warned that an oscillator like Fig. 6.3 is not as simple as it might appear, and as we will see, neither are springs, rubber bands, or pendulums. Also, balls bouncing against moving objects are particularly dicey devices. A simple model with one ball and one oscillating wall is called a Fermi oscillator, and is quite chaotic. The thing in Fig. 6.3 can be even more devilish if m2 is not very small. Caveat emptor!
We have mentioned power-law forces Fadiab=k/y3=ky-3 (6.5), FCoul=k/y2=ky-2, FisoT=k/y=ky-1 (6.4), and lastly Fosc=-ky (6.12), but have forgotten the simplest, namely zero power law Fconst=k =ky0. This last one is like a constant near-Earth-surface gravity force ![]() =
=![]() =mg =-m|g| on a mass m. ( (-) sign fordownward.) Acceleration of gravity near Earth’s surface is nearly -10 meters per second per second and very nearly –9.8. (g=-9.7997m/s2) Terrestrial objects experience this whether they are bundled together or not.
=mg =-m|g| on a mass m. ( (-) sign fordownward.) Acceleration of gravity near Earth’s surface is nearly -10 meters per second per second and very nearly –9.8. (g=-9.7997m/s2) Terrestrial objects experience this whether they are bundled together or not.
All power-law forces F=kyp have power-law potentials U=-∫F·dy=-kyp/(p+1), except for p=-1 where FisoT=k/y has a logarithmic UisoT=-k ln(y). (6.11) Earth-surface potential![]() is linear in height y=h. This we use to compute height of a superball toss by equating its floor level KE=1/2mV2 to maximum PE=mgh.
is linear in height y=h. This we use to compute height of a superball toss by equating its floor level KE=1/2mV2 to maximum PE=mgh.
![]() (6.13a)
(6.13a) ![]() (6.13b)
(6.13b)
Ejection height goes as the square of ejection velocity. A 3-fold velocity gain means 32=9-fold height gain.
It is remarkable that a bouncing mass has a physical property called action![]() that is more or less constant even if its position x momentum P and kinetic energy KE are driven crazy. Action is defined by the area of a one-cycle loop swept out in a momentum vs position phase-plot (P vs x). That is analogous to an energy or power-plot of force vs position (F vs x) whose loop area
that is more or less constant even if its position x momentum P and kinetic energy KE are driven crazy. Action is defined by the area of a one-cycle loop swept out in a momentum vs position phase-plot (P vs x). That is analogous to an energy or power-plot of force vs position (F vs x) whose loop area![]() is work per cycle.
is work per cycle.
Conservation of momentum and conservation of energy are each a rigorously obeyed axiom or theorem for an isolated classical system. However, conservation of action is “more or less” or “sort of” and “it depends” for a driven system. The concept of action is both subtle and deep and it lies at the heart of quantum theory and accounts for a lot of how we affect and are affected by the world around us.
Here we use a geometric construction of a bouncing ball trajectory to quantify action conservation or lack thereof. We suppose the little mass m2 is caught as before in Fig. 5.1 and Fig. 6.1 between a rock and a hard place, that is, bouncing between a big mass m1 (moving in at a constant velocity v1= 1 from the left) and a hard elastic wall. The big ball path is indicated in Fig. 6.4 by a line of slope=1= v1 that hits an initially fixed m2 following a vertical line (slope=0=v2) that then gets knocked up to a line of slope=2=v2 (after Bang(1)). Throughout the imagined collision sequence we suppose the big ball is so much more massive that its change in velocity is not noticeable. This is in spite of the fact that it is absorbing more and more momentum from the little ball with each bang. (Surely, something is going to break eventually!)
Each time the small ball is banged elastically by the big one it picks up two more units of velocity v1 that it maintains, apart from change in sign, through its subsequent bang with the elastic wall. Each time it returns for more, is banged again, and increases its speed by two units.
The horizontal dashed lines in Fig. 6.4 indicate the range <Δxavailable to the small ball at each instant of its bang with the wall. Note that the product of the range Δxand the speed v2 is a constant three units even as spatial range Dxrapidly decreases and the velocity range Dv=2|v2|increases just as rapidly.
Dx v2 =3.0 = <Δx Δv/2
This is an example of conservation of action mentioned before. If we define the small ball’s “range of velocity” by <Δv=2|v2|then this relation takes the form of a weird kind of uncertainty relation, that is, it looks like Heisenberg’s famous minimum uncertainty relation Δx Dp =h=(constant)for position and momentum. It happens that the two are related even though the constant used by Heisenberg is an unimaginably tiny Planck constant (h~10-34Js)compared to a constant 3.0appearing above. (Ours has gadzillions of wave quanta!)
The geometry behind this relation is exposed in Fig. 6.4 (b). It is obtained by considering intersections between lines of integral speeds or slopes v2 =±1, ±2, ±3, ±4, ±5, ±6, ±7,… that are relevant to the bang sequence. They are also relevant to quantum theory where the speeds of a particle in a box are indeed quantized to integers times a tiny number. (This is where that tiny hcomes in.) That is simply a reflection (pun intended) of the fact that mutually reflecting waves require that an integral (or half-integral) number of the wavelengths fit perfectly between mirroring containment walls or cavities.
Now we might ask if the action area <Δx Δvin Fig. 6.4c-e stays the same if the big-ball speed v1 varies. Action variance was argued hotly by Einstein and the “quantum gang” at the1920 Solvay Conference. They imagined a hotel chandelier being jerked up and down by a clerk upstairs. They concluded that if the clerk could not detect the swinging pendulum phase, then he would only rarely change its action.
Action and its wiggly antics will be discussed later, particularly in Unit 7.
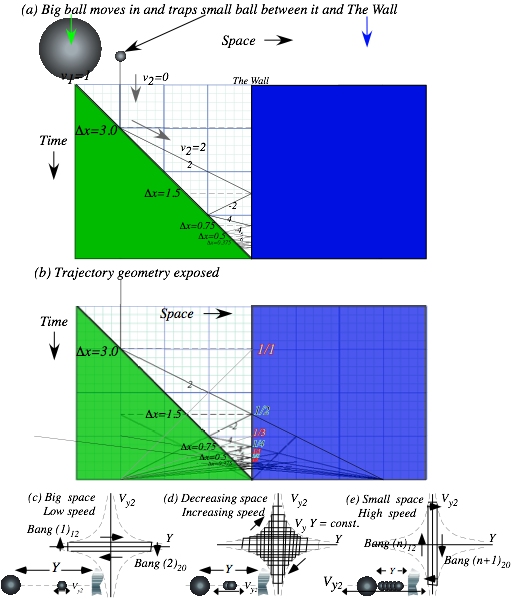
Fig. 6.4 Bang sequence for small ball between big ball and wall. (a) Spacetime paths. (b) Geometry
“Monster mass” M1 bongs hapless m2-atoms in Fig. 6.4 using Galilean symmetry. To show symmetry we imagine two head-on monster M1‘s going at ±V1=±1in Fig. 6.5. A mirror image of Fig. 6.4 lies in extended m2-path lines. The red paths of even integral velocity v2=0, ±2, ±4,… are copies of Fig. 6.4 paths. Odd integral velocity v2=±1, ±3,… paths mesh with even ones to make a full grid. Any initial v2 between ±V1 has a path on the grid. A blue path is drawn thru a series of bongs with v2=-0.2,+2.2,-4.2,+6.2,...in Fig. 6.5.
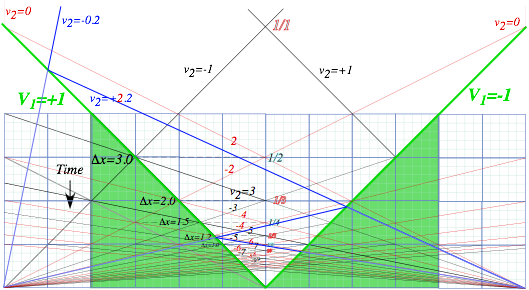
Fig. 6.5 Symmetric pair of head-on V1=±1 monster-m1-masses pong tiny-m2-atoms to higher speeds.
Monster M1/m2-ratios have simple V1-v2-plots shown in Fig. 6.6a. (Recall Fig. 6.2.) It simply adds 2V1 to incoming speed v2 of atom m2 and M1 bounces m2 out at that speed. Monster M1 is the COMand its path bisects in-and-out paths as it balances vIN and vFIN paths of atom m2. (In its COM frame each bong is simply a change of sign for velocity. Recall balance in Fig. 2.6.)
The geometry of adding slope 2V1to speed v2is shown if Fig. 6.6a. It is based on the unit square and unit velocity V1=1. Incoming -vIN2is an altitude of a right triangle with vertical base V1=1, and it is reflected thru the square diagonal to +vIN2then added to 2V1to give sum vFIN2=vIN2+2V1as long side of the triangle with right side vertical base V1=1in Fig. 6.6a. The hypotenuse is the final path with final slope vFIN2. Each m2-path and slope originates at pt-B-or else pt-B+ends of unit square base bisected by unit slope path of M1 at B0. Fig. 6.6.c shows quadrilateral B-B+A+A- bisected by M1 path B0CA0. Similar triangles explain multiple coincidences.
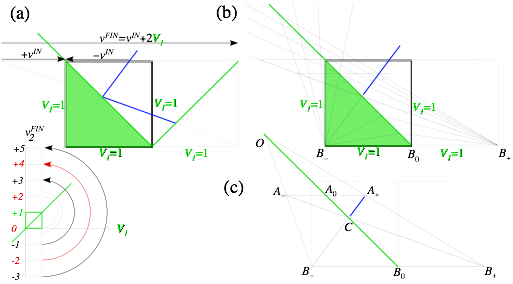
Fig. 6.6 Bisection geometry of Fig. 6.5.
Fig. 6.5 contains time plots for paths in different Galilean reference frames. An excerpt plot in Fig. 6.7a shows how Fig. 6.4 (copied in Fig. 6.7b) appears to a frame traveling at V=1 with each velocity in Fig. 6.7b reduced by V=1in Fig. 6.7a. Also shown in Fig. 6.7a is the extension of lines connecting the two plots and this highlight s this remarkable symmetry. All collision times in Fig. 6.7a match perfectly with ones in Fig. 6.7b though all velocities are shifted. Galileo’s symmetry wouldn’t have it any other way.
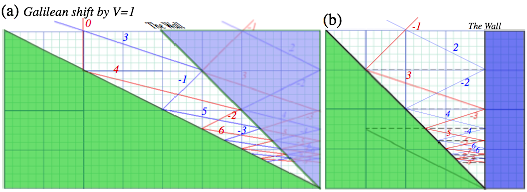
Fig. 6.7 (a) Galilean frame shift by frame velocity V=1 of collision sequence in Fig. 6.4 (shown in (b)).
1.6.1 Fig. 6.3 shows a mass m1 trapped between two high KE balls of much smaller mass m2 that (due to wall bounces) provide m1 with an effective oscillator potential if m1 does not move too far or fast from equilibrium. The example used isothermal force (6.11).
(a) Redo the force properties for the “harder” adiabatic case.
(b) Derive an oscillator spring constant in terms of m2’s KE and compare to that for isothermal KE.
Derivation of force field potentials in Ch. 6 used elementary bangs by tiny m2’s on a big M1. (Ch.5) We predicted elementary bangs between a ball and floor, ceiling, or another ball without knowing potentials. However, three (or more) objects having a ménage a trois are not so easy to predict, and outcomes of 3-body interactions depend sensitively on whatever interaction potential or force law couples the participants.
When a superball or any elastic sphere hits the floor or ceiling it dents itself and, maybe it dents the surface it’s hitting a little bit, too. But, if the floor, wall, or ceiling is much harder than the ball, we might assume only the ball develops a “flat-tire” as shown in the Figure 7.1a below.
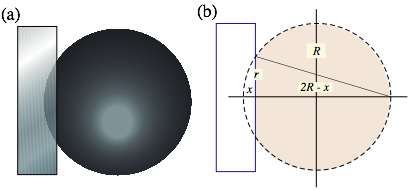
Fig. 7.1 Superball collides with solid wall. (a) “flat” (b) Saggital (“Bow”) mean geometry
The radius r of the ball’s “flat” is indicated by an altitude in Fig. 7.1b and is the geometric mean of the depression distance x and the remainder 2R-x of the ball diameter. (Recall Fig. 1.8.)
![]() (7.1a)
(7.1a)
Solving approximately for depression x gives the Saggital (“bow”) formula. (It’s used for thin lenses.)
![]() (7.1b)
(7.1b)
How much force F(x) is needed to depress the ball by distance x?
The answer is, “It depends.” A hollow rubber ball or balloon with pressure differential P would push back with a force equal to the product of pressure P and area of contact A=πr2.
Fballoon(x) = PA = P πr2 » 2πPRx (7.2)
This is a linear force law like the gravity law (9.4a) inside the Earth. (Look ahead to Fig. 9.6.)
However, the pressure and force in a superball or any solid varies non-linearly with x. Even if force varies only linearly with volume of the x-dent in Fig. 7.1b, it’s still non-linear in x. As seen in (7.4) below, sector volume varies roughly as quadratic x2 function. Super-balls turn out to even more peculiar.
 (7.4)
(7.4)
(Here we check that our integral gives the whole ball volume 4πr3/3 for x=2R. That’s the equivalent of crushing the superball into a black hole (or black sheet). It’s likely to complain before we get that far!)
One of the interesting things to come out of Project Ball was the superball’s peculiar force law behavior. The USC mechanical engineering department took an interest in this crazy project when it showed up on NBC News “Ray Duncan Reports.” They offered to measure the superball force curve on a precise tension meter. But, that curve never worked. It didn’t predict the bounces the students were observing. Nothing was making any sense even though we had a big analog computer working it all out.
That was a low point in the project. Even with all this fancy experiment, computers, and theory, I looked like I didn’t know what the heck I was doing. So, what’s new? That’s science most of the time! But, to make things worse we got kicked out of the Project Ballroom, the old basement Lab 69 that we’d squatted in. It was up to be repainted so we had to drag all our stuff out of there and store it down the hall.
Well, after that I had to do something with the students so I arranged for a visit to Whammo Mfg. Co. in San Gabriel, California, where superballs and other goofy stuff was made. The Whammo man said maybe we could talk business about selling our super-elastic effects as a toy. So, a day or so later, with $$-signs in our eyes, we piled into our cars and drove down to the plant.
By the time we got there, the inventors were on an all-day “alpha-wave break.” That’s a 60’s fad where you try to increase your creativity by looking at your brain waves. I said, “Maybe, I could use some of that stuff!” But, the company lawyer wanted to show us around. After awhile, he said he thought our invention was cool, but its product liability potential looked too high to make a commercial toy.
We all must have looked pretty sad after hearing that. So he went in a back room and dragged out a big collection of superballs that had been rejected for one reason or another. “Here, take as many as you want!” We thanked him and loaded the balls into some boxes and headed back to USC.
When we got back to Rm 69, the painters were done but the paint wasn’t quite dry. So I said, ”Let’s drop off our new balls so we’re ready for tomorrow.” The students took “drop” to mean literally and dumped them out of the boxes into the empty room. Right away the balls bounced into the wet paint and made lots of little polka-dot spots all over the floor and wall. What fun! What a mess.
But, suddenly, it occurred to me what was wrong with our force analysis and how we might fix it. The engineers had carefully and slowly produced a static or isothermal force curve, but what we really needed was a fast-response or adiabatic force curve. I thought, “Maybe that force law can be told by the polka-dots!”
From a polka-dot radius r made by a superball of mass M and radius R dropped from a height h we could relate gravitational potential energy Mgh to an adiabatic superball potential energy U, that is, find a U(x) curve for each value of x=r2/2R in formula (7.1b) by plotting height h against x given by dot radius r. Then the adiabatic force curve F(x) can be found from the slope dU(x)/dx of a U(x) curve.
Just as the adiabatic F=1/Y3 in (6.5) force curve is steeper and curvier than the isothermal F=1/Y in (6.4) so was the polka-dot bounce curve steeper than what we had been using. We stuck our new F(x) on the analog computer’s diode function generator and started getting good predictions. Now we could work out the deadly Model-X3, a 3-ball super tower! (This is described later in Chapter 8.)
First, let’s look carefully at this “polka-dot” potential theory. What we did, like most of physics, was an approximation. Using gravitational potential to estimate superball U(x) is a neat trick only if the superball forces are large and quick compared to the gravitational force or weight mg of the ball.
Fig. 7.2a shows a massive (Bowling-ball sized) superball at its (V=0) drop point h, where potential energy is mgh. Kinetic energy rises from zero as the ball falls down until it passes a point where the upward floor force cancels the ball’s downward weight mg. That point-xstatic of static equilibrium is at the bottom of the total potential energy curve in Fig. 7.2b. The ball would sit still if put gently at xstatic with no kinetic energy. It’s a point of zero slope since total force F(xstatic) is zero there.
After passing xstatic the ball slows down due to negative F(x< xstatic). Finally it will have to stop at its maximum penetration point xmax where the energy line intersects the total potential line in Fig. 7.2c. Now the ball’s gravity potential mg has been converted completely into potential energy U(xmax) (and frictional heat that we’re ignoring) due to compressing rubber a distance xmax into the ball.
In the example, the ball’s weight is almost as large as the inertial bang-force driving the ball into the floor. An indication of this is how flat the ball is in Fig. 7.2 b when its weight and compressive force are equal. A standard superball sits stiffly on a table with no noticeable depression, and mg is a tiny part of the total force, and because it’s so stiff, its bang force is hundreds of times its weight and lasts only a few hundredths of a second. Very stiff rebounding potentials are shown in the later Fig. 7.3 and Fig. 7.4 b in which gravity is a negligible force after such a stiff rebound begins.
By comparison, the ball in Fig. 7.2 is heavy and its potential is not so stiff. Instead it is so soft it has a big “flat” if sits still with zero KE at xstatic just as it does when passing that point in Fig. 7.2 b. The collision shown in Fig. 7.2 a-c is less like a bang and more like a lingering smooch! Similarly soft collision energy for a linear rebound force and quadratic potential is shown in parts (d) and (e) of Fig. 7.4.
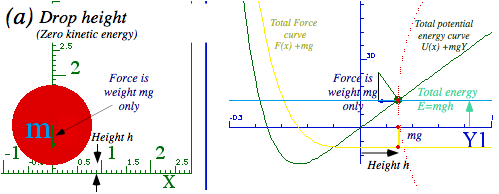
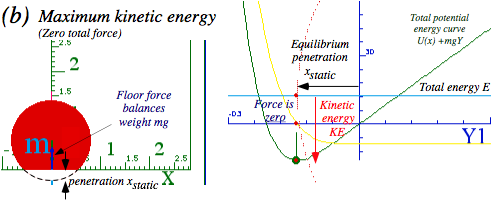
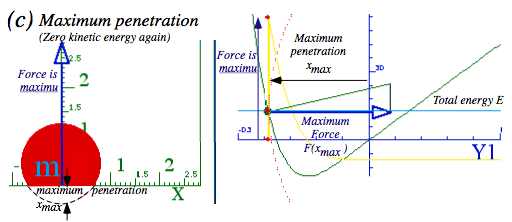
Fig. 7.2 Details of ball hitting floor (a) Ball is dropped. (b) Ball at max speed. (c) Ball at low point.
TV daredevils jump off 30-meter towers and belly-flop into kiddy-pools that are less than 1 meter deep. What a way to earn a buck! And, how do they ever survive such stunts?
Two important physical quantities tell about survival chances. The first is the product F˙x of force-times-distance, or, more precisely, the integral ∫Fdx of force over distance. The second is the product F˙t of force-times-time, or, more precisely, the integral ∫Fdt of force over time. (Recall the fundamental Galileo-Newton relations (3.10) and (6.0).)
The first quantity ∫Fdx is work done or energy -U(x) acquired. U(x) is area under an -F vs. x plot.
![]() (7.5a)
(7.5a)
If energy is stored as potential energy U(x), then force -F(x) is the slope of a U(x) plot at point x.
![]() (7.5b)
(7.5b)
(Recall the discussion of force and potential leading up to (6.10).)
A second quantity ∫Fdt is impulse done or momentum P(t) acquired and area under an F vs.t plot.
![]() (7.5c)
(7.5c)
If momentum is stored in kinetic velocity V(t)= P(t)/M then force F(t) is slope of the P(t) plot at time t.
![]() (7.5d)
(7.5d)
The time equation (7.5c-d) is just Newton’s 2nd law given by (6.0). The space force law (7.5a-b) is just the slope rule first stated (with the physicist’s minus-sign) in (6.9). Both laws deal with conserved stuff. If you, a daredevil, acquire x of this stuff (energy or momentum) sooner or later you are going to have to find something or someone help you get rid of x. Or else!
A daredevil falling 30 meters acquires energy equal to gravity force (body weight Mg) times thirty meters. Fig. 7.3a-b plots a constant F=-Mg and a linear potential U(y)=Mg y from y=30 to y=0. The 1m kiddy-pool must get rid of the 30Mg (Newton meters) of energy in one meter, by applying a force of 30Mg (Newtons) steadily over the entire meter from y=0 to y=-1. (That’s a 30g~300ms-2 deceleration. Human survivability is somewhere around 50g.) An alternative is to get rid of that energy in the concrete below the pool in about 1millimeter, a 30 thousand g deceleration. (That is not survivable!)
Suppose the daredevil falls onto a special trampoline that applies exactly the same constant force as the kiddy-pool, but stores the energy as potential instead of dissipating it all by dousing the audience with a huge splash. (Recall Ka-Bong! versus Ka-Runch! in Ch. 1.) The trampoline could then toss the daredevil back up to the 30 m tower to do the fall over again. (My gosh! What a daredevil has to do to satisfy a sated TV audience these days!) Such a potential is plotted by a steep-slope line U(y)=-30y in Fig. 7.3b.
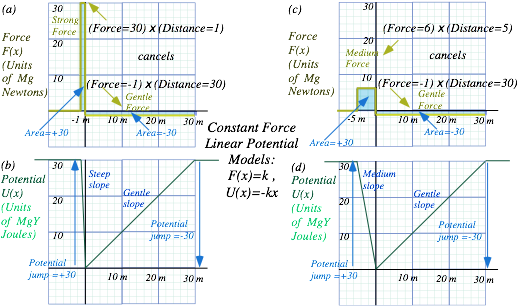
Fig. 7.3 Force and potential plots. (a-b) Strong (30g) deceleration. (c-d) Medium (6g) deceleration.
Suppose the Americans for Humane Daredevilry (AHD) demand that the deceleration distance be increased from 1 meter to 5 meters. (That’s what Olympic divers get for a 10 m fall.) As shown in Fig. 7.3c this reduces the deceleration by a factor of 5 from 30g to only 6g. (A walk in the park!) The sloping U(x) lines are tallying the area-accumulation under the F(x) lines. Starting on the right hand side, U(x) drops by 30 units in 30 meters in Fig. 7.3b to correspond to the –30 units of area under the gravitational F=-1 unit line for the same distance in Fig. 7.3a. The daredevil’s kinetic energy must increase by 30 units to conserve total energy. So trampoline or pool is hit at 24 meters per sec. or 55 mph. (Recall (6.13).)
1/2 M V2=30 Mg or: V=√(60g) = √588=24.2m/sec.
Getting rid of this 30 J potential deficit means climbing a steep 30 J high slope between y=0 and -1 in Fig. 7.3b or a medium slope of the same height between y=0 and –5 in Fig. 7.3d. Both cases have the same +30 J area under a force line, but having 5 meters instead of just one reduces the force to 30/5=6.
Time functions F(t) and MV(t)=P(t) relate to F(x) and U(x) using Newton II: F=MdV/dt in (7.5d).
![]() or:
or: ![]() (7.6a)
(7.6a)
![]() or:
or: ![]() (7.6b)
(7.6b)
The first relation is total energy conservation (KE+PE=const.) first stated in (6.6) and (6.7).
Let’s imagine the AHD demands further protection of daredevils from themselves by outlawing constant-force targets that turn on a full force suddenly upon entry. Claiming that “high-jerk” is bad, the AHD requires linear-force targets, instead. Physicists comply happily since a harmonic-oscillator linear-force-quadratic-potential (6.12) is the favorite force law. It also describes inside-Earth oscillation in Chapter 9.
Plots of linear-force-quadratic-potentials are shown in Fig. 7.4. Just like the preceding Fig. 7.3, a constant gravitational force Fgrav=-Mg is present both in and out of the (y<0)-region where the linear F=-ky force and the U(y)=1/2ky2 potential exist as a sum of constant and linear forces for (y<0).
![]()

(7.7a) (7.7b)
If a linear potential b·y is added to a quadratic a·y2 potential we get the same parabolic curve U=a·y2, but that curve is shifted to the left by yshift=-b/2a and down by Ushift=-b2/4a as follows.
![]() (7.8a)
(7.8a)
![]() (7.8b)
(7.8b)
The nose or tip of the parabola, which is the equilibrium resting point, follows an upside-down copy of the U-parabola itself! This important geometric fact is shown in Fig. 7.4. The geometry does not reveal itself until we look in Fig. 7.4e at a “soft ball” that is soft enough to clearly show its gravitational shifts. A hard superball is more like Fig. 7.4b that barely shows such a small shift.
Hardball total potential is u(y)=8y2+y with a total force function f(y)=-16y-1 in graph units of Fig. 7.4(a-b). A medium total potential is u(y)=y2+y with a total force function f(y)=-2y-1 is plotted in Fig. 7.4(c-d). The latter clearly shows the equilibrium or lowest “sag” point of zero force. The softball total potential is u(y)=(1/4)y2+y with a total force function f(y)=-(1/2)y-1 in Fig. 7.4e. The hardball potential requires about 6 meters (Y=-6 or y=-0.6) to cancel the energy from the 30 meter fall (from Y=30 or y=3) and maximum force of about F=10. This is much more than the constant F=6 that stopped the same daredevil in 5 meters in Fig. 7.3c because a linear force has only the area under a triangle which has a factor of 1/2. Here 1/2(F=10)(Y=-6) gives the necessary energy of 30 Joules. So the AHD ruling has actually increased the maximum force on the daredevil! (But, only during the final milliseconds is F large.)
Note that the focus of the U(y) parabola is on the y-axis because we plot gravity with slope=1. Can you find a geometrical a way to locate that focus given some allowed stopping distance?
Parabolic geometry of an oscillator potential subject to a uniform (or nearly uniform) force field is an important one in physics. Electronic charges pinned to an atomic potential well behave like oscillators in an electric field of a passing light wave. Generally the light wavelength of 0.5 micron (0.5E-6m) is several thousand times as long as the atomic radius of a few Angstrom (1E-10m). So the effective potential is a rigid parabola like Fig. 7.4e shifting to and fro and up and down at some frequency.
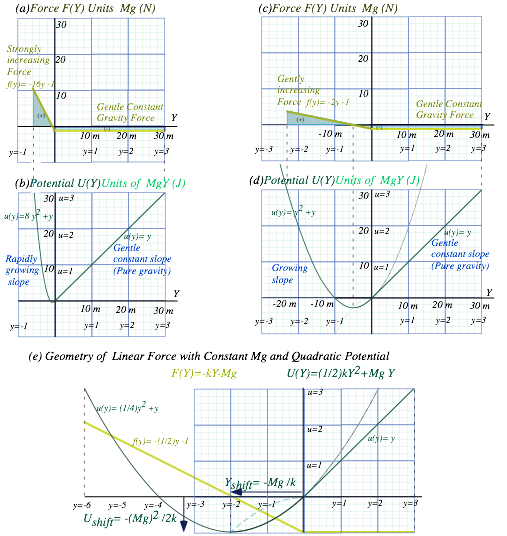
Fig. 7.4 Linear deceleration force after constant falling force. (a-b) Hard (c-d) Medium (e)Soft
As mentioned before, a superball force function is non-linear and approximated by Fball(y)~y4 as plotted in Fig. 7.2 and Fig. 7.5 below. Compare this to the linear balloon-like force curve Fballoon(y)~y1 in Fig. 7.4e above. (Recall (7.2).) Note that Fballoon(y) is a pair of straight lines bent at contact point y=0, while Fball(y) has a long flat region below y=0. A flat in F(y) assures super-elastic bounce as we’ll see. For either case, the force integrals ∫Ftotal(y)dy and the areas they represent cancel between any two points y=h and y=ymax that have the same potential energy U(h)=E=U(ymax). If that energy is the total energy E then these points y=h and y=ymax are the classical turning points where the mass M stops with zero KE and zero speed to turn around and fall backward or forward, respectively, into the potential valley in between the turning points. This is a common feature of most oscillatory motion or vibration.
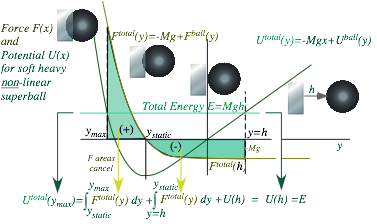
Fig. 7.5 Force and potential for soft nonlinear (F=ky4) superball dropped from height h
Super-elastic bounce involving two balls was introduced way back in Fig. 4.5 and “explained” by the 2-Bang model sketched there. Is that the only explanation? Certainly not! Is it even right? Well, yes and no. Here is a chance to discuss how science works or doesn’t work. It is, after all, a human endeavor. (To err is…)
Let’s imagine a big scientific fight between two research groups something like real ones I’ve seen. We’ll imagine it’s about superball dynamics. On one side is a small but creative group working for the Rumpany Company® that first discovers the effect and explains it with the 2-Bang model. But their small budget limits them to things you can do cheaply with a ruler and compass.
On the other side is the huge Crap Corporation®. With unlimited military contracts, CrapCorp can afford any kind of computer or lab equipment. They hear about RumpCo’s discovery and decide to develop and sell it to the Army as a bomb detonation system.
I hope you’ll excuse a scatological nomenclature and contempt for shortsighted and mindless goals often associated with post-modern cash-flow-science. My allegorical objective is to encourage curiosity-driven-science that is now becoming regarded as quaint. I do believe that humans are capable of creating much more than fertilizer and should be strongly encouraged to do better. If earning gets in the way of learning, then humans do poorly. I have watched big labs in government, industry, and university die of a pernicious groupthink fueled by the acquisitive rather than the inquisitive human drives. People lose their ability to reflect and become happy to merely genuflect. A novel Radiance by Carter Scholz (Picador 2002) is a “Star Wars” romaine a’clef exposing foibles of scientists at Livermore and Los Alamos.
On one side of our allegory is poor but resourceful little RumpCo full of ideas but nowhere to go. Their 2-Bang model of super-elastic bounce is simple, elegant, but appears wrong. The powerful CrapCorp, on the other hand, knows where it’s going and what’s right. It has every resource imaginable. Except wisdom.
CrapCorp’s first move is to discredit RumpCo’s work. They set up a computer that uses lab observed potential functions to fully analyze a 2-ball bounce. Let’s compare two competing vu-graphs side-by-side.
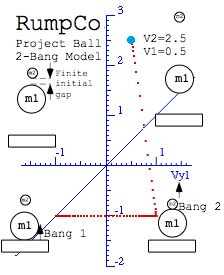
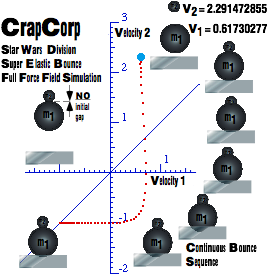
Fig. 7.6 RumpCotheory versus CrapCorp’ssimulation. (RumpCo) Finite initial gap (CrapCorp) NO gap
One thing is clear. CrapCorp does fancy-schmancy vu-graphs! They resemble wedding invitations.
And, while CrapCorp’s 10-figure precision is dubious, we note their V1=0.62 and V2=2.29 disagree with RumpCo’s predictions (Recall Fig. 4.4.) of final V1=0.5 and V2=2.5 by a little. Furthermore, RumpCo uses an independent 2-ball bang model. They assume or idealize an initial gap separating mass m1 from m2 so Bang-1 of m1 with the floor is independent of Bang-2 between m1 and m2. So V1 and V2 result from 2-body energy-momentum conservation. RumpCo’s results are not sensitive to force functions.
CrapCorp can compute the difficult 3-body collision between m2 , m1, and m0 (the Earth) all together just like what’s really happening on the floor. CrapCorp ‘s curvy V1 vs. V2 plot in Fig. 7.6 is very sensitive to each force function F(y) between each pair of colliding bodies. When (and if) CrapCorp values check out with experiment, they’ll happily sneer at the primitive pair of straight lines in the RumpCo velocity plot.
Does RumpCo have nearly the right (V1,V2) for wrong reasons? Not entirely. The reason a 2-Bang model works at all is that the force function for these balls is highly non-linear. A quartic function F(y)=y4 has a flat bottom as noted before Fig. 7.5. That allows the floor-m1 collision to nearly finish before the m1-m2 bang really gets going even though the balls are in contact all during the collision.
Realizing this, the RumpCo researchers suggest that CrapCorp try a linear force F(y)=y1 simulation to see if super-elastic bounce disappears. They do, it does, and the rest is history. As seen in Fig. 7.7, m1 and m2 bounce up in unison. It’s a pax de deux. Super-elastic bounce goes away!
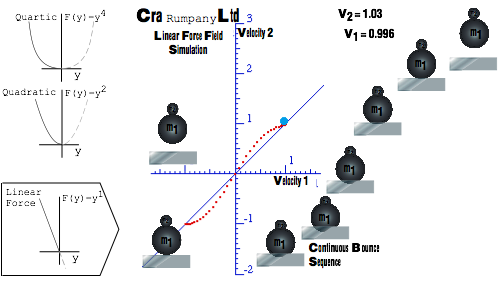
Fig. 7.7 Linear force kills super-elastic bounce. (Collaborative effort.)
The two groups decide to stop feuding and join forces. A corporate merger results in a multi-national conglomerate Carumpany Ltd. based in the Caymans. They lived happily ever after. (Well, sort of.)
Another important physics lesson from this section is, “Fasten your seatbelts…tightly!” To avoid great and damaging force you need to avoid non-linear force functions and fasten yourself with linear ones that can start working off your kinetic energy and momentum most immediately after a collision. The non-linear force with its “flat” region applies little or no force at first but then has to make up for its procrastination with deadly high force after it’s too late. Note how nonlinear force in Fig. 7.5 finishes much higher than the linear force in Fig. 7.4. Even worse is having no seatbelt at all. That’s like a very non-linear force of, say, F(x)=kx100. It’s a flat gap with a practically vertical wall waiting to crush you!
One of the most dangerous vehicles in the Wild West of the early US was the buckboard, a wagon with no suspension except for a set of springs right under the rider’s seat. When the buckboard hit a bump it generally lived up to its name. Unfortunate riders ended up like a little m1 superball knocked skyward by a big m2 wagon. A safer and more comfortable ride is had in a car with a body as much heavier than the wheels and suspension as possible. Monster trucks have the worst kind of ratio possible for stability.
Slowly we have put back some of the “real-world” features of the superball collisions that our idealized “Bang-Bang” models of Ch.4 ignored in order to make the problems more easily solvable. The effects of gravity during collision have been introduced and applied to interacting zero-gap superballs.
More such effects will be studied in what follows since interacting linear forces are very common in nature and there are ways to make them easily solvable, too. The oscillating neutron star in Ch. 9 provides a taste of what is to come in the study of waves and oscillation in Unit 4 and orbits in Unit 5.
But even the neutron star model neglects what is the bane of the purist physicist, the dreaded frictional forces. These are among the most neglected and poorly treated physical effects in physics. If anything goes wrong with a theory, we just blame it on friction! Often we have little choice in this matter.
Friction is a result of having more particles than we’d like to admit. Consider one m1=72 gram superball. That’s about a mole of Carbon C6 rings and a mole has 6.02E23 (That’s Avogodro’s number.) of these C6 molecules. So we’re dealing with not one mass m1 particle but an enormous heap with an unimaginably huge number 60,200,000,000,0000,000,000,000 of particles that individually are (mostly) friction-free and well behaved, but their mob-behavior is just plain abominable!
You’ve got to get down to at least the individual molecular level before “internal-friction” is pretty much a non-existent phenomena and pure quantum wave mechanics rules. So what we call “frictional loss” is simply the best accounting we can do of 60.2 gazillion chiseling thieves stealing bits of energy that turn up later as “heat.” In conservative economics the effect is known as “supply side” or “trickle-down.” Let’s see if we can account for energy chiseled by just three thieves. (And, then we’ll hire more thieves until we bankrupt the whole operation!)
Without knowing force and potential effects on superball collisions, it is often impossible to even approximately predict the outcome for N=3, 4, or more balls. But, if all N masses have independent one-on-one collisions with the floor, the ceiling, and each other, prediction can be done “Bang-by-Bang” as in Ch.5. Difficulty arises when three or more collide at once. Then prediction may need precise and detailed treatment of their interactive force laws. Elastic binary or one-on-one collisions in one dimension are solved completely by momentum conservation alone as we’ve done since Ch. 4. But, as we’ll see, anything more complicated may require more work, and often it requires a lot more work!
One of the goals of Project Ball at USC was to optimize final velocity for superball towers with three or more balls stacked up like a pyramid as in a multi-stage rocket. One dumb idea was a cheap satellite launcher. It’s dumb because, even if you could achieve 8 km/s (See discussion in Ch. 9.), you’d burn it up in the atmosphere. (Well, OK, but on the moon…?)
Actually we were happy just to break the theoretical 2-ball limit of 3.0-times-initial. (Recall discussion of the INF limit in and after Fig. 4.5.) As seen in Fig. 8.1a that is done quite easily by a 3-stage tower which achieves a velocity that is V3=3.41 times initial drop-speed (Vn(0)=1 for n=1,2,3).
An even better final speed of V3=3.62 is had in independent collisions caused by setting initial gaps between the falling balls as shown in Fig. 8.1(b) so each collision can be completed before the next one begins. Then the result becomes independent of the force law governing the detailed trajectory within each collision, and a geometric construction in Fig. 8.1(b), based on momentum conservation, finds velocity accurately if collisions are independent. This requires force non-linearity or large initial gaps that are enough to reduce or eliminate N-body contact effects for N>2.
Conversely, zero initial gaps often reduce the final velocity maximum below independent collision values. This is particularly true if the force law is linear as shown in Fig. 8.1(c). The 3-ball linear case comes out very much like the linear case for a 2-ball tower in Fig. 7.7. No single mass gains much speed over its neighbors. Super-elastic bounce is essentially squelched.
The American Journal of Physics† paper produced by Project Ball contains a discussion of attempts to optimize super-elastic bounce in towers of 3 or 4 balls. Progress was made but the theory needs work. As we will see later, this dynamics is somewhat analogous to wave motion in a varying channel. An early AJP paper†† has an analogy between a trumpet and a chain of sliding balls whose masses increase geometrically. It’s also analogous to tsunami wave build-up. A rule-of-thumb is that optimum-velocity chains satisfy a geometric-mean mass relation m2=√( m1 m3) as is approximately so in Fig. 8.1. Later on, some of this technology was developed into a toy by Stirling Colgate (astrophysicist and toothpaste heir) and company.
† Class of WGH, Am. J. Phys. 39, 656 (1971).
†† J. B. Hart and R. B. Herrmann Am. J. Phys.36, 46 (1968).
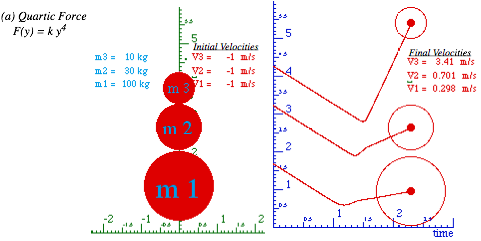
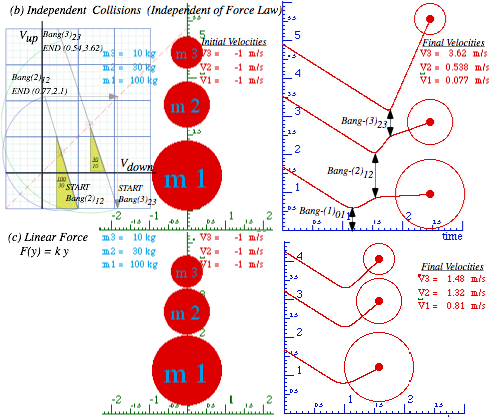
Fig. 8.1 Dropped 3-ball tower. (a) Quartic force (b) Independent (Finite gap) (c) Linear force.
The 3-stage collision construction in Fig. 8.1b uses earlier construction of Fig. 4.4. It begins after the lowest mass m1=100 has rebounded from the floor to the Bang(2)12 START point (V1=1,V2=-1) where it meets mass m2=30 and bangs up to Bang(2)12 END point (V1=0.77,V2=2.1) on a slope 100/30 line.
The second velocity (V2=2.1) of mass m2=30 is then transferred (See gray arrows.) to the first component of Bang(3)23 START point (V2=2.1,V3=-1). There m2 meets mass m3=10 and bangs it up to Bang(3)23 END point (V2=0.54,V3=3.62) on a slope 30/10 line, giving final top m3 velocity V3=3.62.
A 4-stage collision tower sequence with nearly the same mass ratios is constructed in Fig. 8.2(a). Here each mass m1, m2, and m3, is exactly 3-times the one above it, and the top mass m4 gets the biggest boost of nearly 5.8. Recall Maximum Energy Transfer (MET) case in Fig. 4.5 where a mass ratio of three (m1/m2=3) leaves the lowest ball stopped (V1=0). In Fig. 8.1b m1 is nearly stopped. (V1=0.077).
The same arrangement with a higher mass ratio mk/mk+1=7 is constructed in Fig. 8.2b. Here the top mass m4 gets a boost of over 9.0. That is a kinetic energy boost factor of (V4)2=81 and an altitude bounce of four or five hundred feet if dropped from arm’s length. (Friction is being seriously neglected!)
Imagine dropping two towers like the ones in Fig. 8.2a-b from either side of a tunnel through the Earth so the two lowest m1-masses run into each other at the center. If the resulting collisions were elastic, they could send the other masses to infinity with energy to spare! Later we see escape from Earth’s surface takes only three times the energy it takes to sit there. (Starlet escapes!) Energy factors for a conservative 3:1-tower are 22=4, 3.52=12.3, and 5.82=34.8 and more than enough for a free ride to kingdom come. Astrophysical modeling of Type-II supernovae reveals just such a high speed SSDEB when a star, like a spherical layer-cake with lighter elements above heavier ones, collapses. Boom! It appears that most of our bodily stuff has come along on such a ride! As Carl Sagan remarked, we are of blown-up stars.
Novelty stores have simple examples of multistage collisions made by hanging identical ball bearings in line as sketched in Fig. 8.2c-d. These are also common lecture demos, and they have been called “Newton’s balls.” That can at least elicit some giggles from otherwise boring lectures.
Few teachers explain the details of the cool pop-up-single in Fig. 8.2d. In fact, it won’t work unless all the collisions are independent, and this requires non-linearity of the sphere-on-sphere force function, as we saw in Fig. 8.1. Cooler still, is an elastic 4-ball column-bounce in Fig. 8.3c. N-balls need N(N+1)/2(=10 if N=4) independent bangs to get all N balls back with the same speed. Given this, it seems a wonder that solid objects can bounce elastically. (In fact, they cannot, quite!)
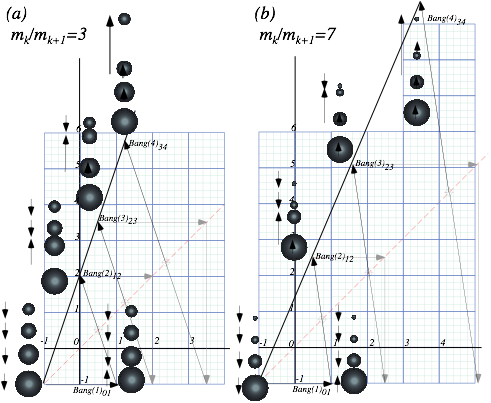


Fig. 8.2 4-ball towers. Mass-ratios mk/mk+1 (a) 3, (b) 7, (c-d) 1. Independent bangs needed for all.
Perhaps, you noticed that FINAL velocity values could be found from INITIAL values by two different ways. Back in Fig. 2.1 we noted an easy way using a momentum conserving straight line and a circle through VCOM from vIN to the answer vFIN. But, Fig. 3.1 showed another way using an energy-conserving ellipse to connect vIN to the answer vFIN. The first way uses simple linear equations and the second way uses more complex quadratic equations.
Why are there two ways? Often this means that situations exist where both are needed. Here friction or inelastic collisions make total kinetic energy decrease. (Recall our 60.2-gazillion thieves? They’re baa-ck!) Such a situation is plotted in Fig. 8.3b with the energy decrease indicated by a smaller ellipse inside the initial ellipse in Fig. 8.3a. This similar to an earlier Fig. 3.2.
The idea is that momentum conservation is still true even if the two masses are exerting sticky, energy-wasteful, forces on each other. No matter how wasteful those inter-particle forces may be, they still must obey Newton’s 3rd axiom demanding equal-and-opposite forces on each other. So the final answer for vFIN must be at an intersection of the old momentum line with a new and smaller ellipse.
However, intersecting an ellipse and a line uses a quadratic equation. And, in Fig. 8.3, there appear two solutions to the quadratic equation. One uFIN we want is near the old energy-conserving vFIN. But, the other one that we now don’t want is a uIN, which is nearer to the old vIN.
Let’s look at a quadratic equation for u1FIN. There are two given constants KE(u) and MVCOM.
![]() (8.1)
(8.1) ![]() (8.2)
(8.2)
The COM momentum pu in (8.1) is a constant during the entire collision. Not so for the kinetic energy ku in (8.2). It’s just a given loss parameter that is quite difficult to predict. We first solve pu for u2.
![]() (8.4a)
(8.4a)
Then we insert the u2 result into ku equation (8.2) to get the needed quadratic equation for just u1.
![]() or:
or: ![]() (8.4b)
(8.4b)
The solution isn’t pretty but its ± gives both u1FIN and u1IN shown in Fig. 8.3b.
![]() (8.5a) (8.5b)
(8.5a) (8.5b)
The unwanted (+) solution u1IN (given that we started with v1IN) means the two balls “wiffle” through each other. In classical physics, only u1FIN makes sense starting with v1IN and only u1IN makes sense starting with v1FIN. In quantum theory, masses can “wiffle.” Then both solutions make sense (sort of).
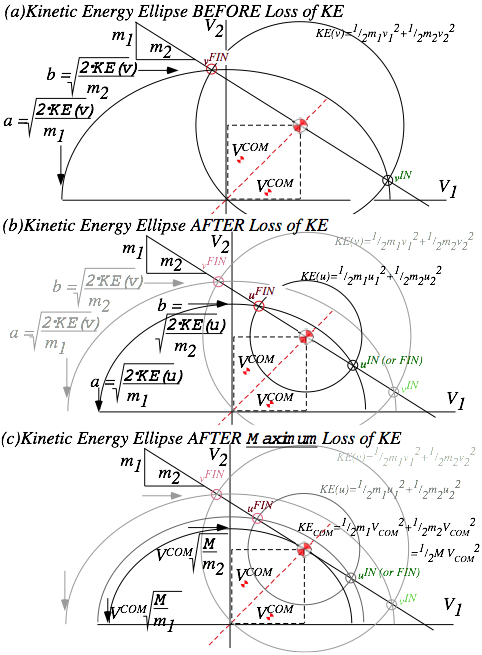
Fig. 8.3 KE-Ellipse shrinks by frictional loss. (a) Elastic (No loss). (b) Inelastic. (c) Totally inelastic.
Can you do quadratic solutions (8.5) with a ruler and compass? At first this seems difficult, but the energy ellipse construction in Fig. 3.5 and geo-mean square root construction in Fig. 1.8 can be used.
As shown in Fig. 3.6, an ellipse has two radii, a major radius a giving x-coordinate x=acosθ, and a minor radius b giving y-coordinate y=bsinθ. The Cartesian ellipse equation (3.7) is satisfied by these x and y, and polar angle parameter q is eliminated. (x and y may switch places.)
![]() (3.7)repeated
(3.7)repeated
Velocity values x=V1 and y=V2 have equal magnitude for initial Bang(0) (V1=-VIN, V2=-VIN) or Bang(1) (VIN,-VIN), and for a totally inelastic final state (V1=VCOM, V2=VCOM). The geometry needed to solve for the initial elliptic radii (aIN, bIN) in Fig. 8.3a or totally inelastic radii (aCOM, bCOM) in Fig 8.3c is described in Fig. 8.4. Then an energy ellipse in (V1, V2)–space such as sketched in Fig. 8.3b may be constructed for any radii (aFIN√R, bFIN√R) where the energy retention ratio R= KEFIN/ KEIN ranges from R=1 down to Rmin=(aCOM/a)2=(bCOM/b)2 as (aFIN, bFIN) range from initial radii (aIN, bIN) to totally inelastic (aCOM, bCOM) at the lowest KE allowed by momentum conservation.
The roots (8.5) are two points where energy ellipse and momentum line intersect. For totally inelastic collision they coalesce and the momentum line is tangent at (VCOM, VCOM) as in Fig. 8.3c. The slope m1/m2=a2/b2 of the momentum line is fixed no matter how much energy is wasted. So is ellipse aspect ratio a/b=√(m1/m2). Square root construction (from Fig. 1.8) finds a/b from a2/b2 in Fig. 8.4a-c.
The construction begins by boxing the momentum line in the 1st quadrant and doubling it using a semi-circular arc around its upper left hand corner. An extended box including the arc is drawn in Fig. 8.4b. The center of the extended box is the center of a second arc that finds the square root √(m1/m2) of the momentum line slope in Fig. 8.4c that is the desired ellipse aspect ratio a/b of all possible energy ellipses for the masses m1 and m2. The basis of this construction is the mean geometry of Fig. 1.8.
Location of radii aCOM and bCOM in Fig. 8.4d uses vertical and horizontal projections of pt-(VCOM, VCOM) to the (√(m1/m2)=a/b)-line. This is helped by the fact that pt-(VCOM, VCOM) lies on the ellipse and on the 45° line so that its x-coordinate (x=acosθ) and y-coordinate (y=bsinθ) are equal. Thus angle parameter is tan-1a/b= q, the a/b line slope. So x and y projections of (VCOM, VCOM) onto the q-line yield hypotenuse lengths aCOM and bCOM in Fig. 8.4d. Concentric circles of radii aCOM and bCOM let us construct the ellipse as in Fig. 3.5.
Initial pt-(VIN, VIN) gives initial elliptic radii aIN and bIN in Fig. 8.4e. Square-radii ratio (aCOM/ aIN)2=(bCOM/bIN)2 or ratio (aCOMbCOM)/(aIN bIN) of the two ellipse areas lets us find the lowest possible kinetic energy retention ratio Rmin. You should prove (geometrically and algebraically) that minimum ratio is given as follows.
![]() (8.6a)
(8.6a) ![]() (8.6b)
(8.6b)
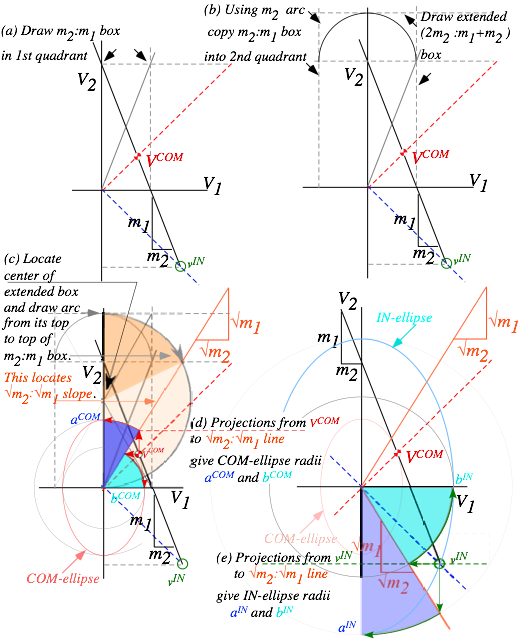
Fig. 8.4 Energy ellipse geometry. (a-c) Axes ratio √m2:√m1. (d) aCOM and bCOM. (e) aIN and bIN.
N-body collisions described so far have been mostly elastic. That’s not true for California freeway pile-ups. California pile-up chains start when a cell-phony driver enters a fog at 60 mph and rear-ends a vehicle or vehicles that have slowed down or stopped. Cars drive bumper-to-bumper so dozens may be involved.
Pile-up mass grows with each car added to it by a series of inelastic “Ka-runch” collisions like Fig. 2.1 of Ch. 2. Cars may be added to a pile-up’s rear or to its front or even to both ends. Fig. 8.5 shows a single 60 mph car piling up a line of five stationary cars and, vice versa, Fig. 8.6 shows a line of five 60 mph cars piling up on a single stationary car. Each pile-up collision loses as much energy as it can while keeping momentum constant. It makes the smallest ellipse that touches the momentum line in Fig. 3.2c and Fig. 8.3c.
In each case the sequence of velocity-velocity slopes is an arithmetic progression 1:1, 2:1, 3:1, 4:1,… similar to velocity sequences in Fig. 6.4 and Fig. 6.5. Both have lines that intersect on a single point and inverse or complimentary slope sequence 1/1, 1/2, 1/3, 1/4,…, known as a harmonic progression.
The incoming car in Fig. 8.5 has momentum PIN=mv=60 and energy KEIN=![]() mv2=1800 with v=vIN=60. The final pile-up mass M=6 has the same momentum PFIN=MV=60 but reduced velocity V=vFIN=10 and energy KEFIN=
mv2=1800 with v=vIN=60. The final pile-up mass M=6 has the same momentum PFIN=MV=60 but reduced velocity V=vFIN=10 and energy KEFIN=![]() MV2=300 down by 1500 units. (These are (very) Old English units with unit mass (m=1 ton) cars.)
MV2=300 down by 1500 units. (These are (very) Old English units with unit mass (m=1 ton) cars.)
The incoming cars in Fig. 8.6 together have momentum PIN=5mv=300 and energy KEIN=5![]() mv2=9000. The final pile-up mass M=6 has the same momentum PFIN=MV=300 with increased velocity V=vFIN=50 but reduced energy KEIN=
mv2=9000. The final pile-up mass M=6 has the same momentum PFIN=MV=300 with increased velocity V=vFIN=50 but reduced energy KEIN=![]() MV2=7500. The same energy deficit of 1500 units is seen in Fig. 8.5 and Fig. 8.6.
MV2=7500. The same energy deficit of 1500 units is seen in Fig. 8.5 and Fig. 8.6.
Of these two equal-energy-loss nightmares the latter is worse since it began with five times the kinetic energy and still has 7500 units to dissipate. Worse nightmares combine the two as shown in Fig. 8.7. This a particularly troubling set of nightmares since there are many possible outcomes that have different orders of combination with differing results.
How would you like to be an insurance adjustor for that one?
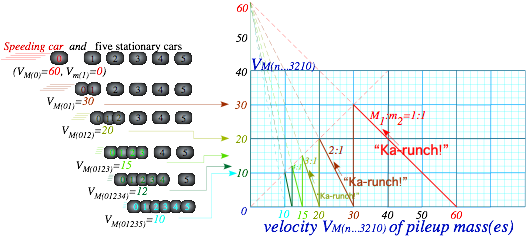
Fig. 8.5 Pile-up due to one 60 mph car hitting stationary line of five cars
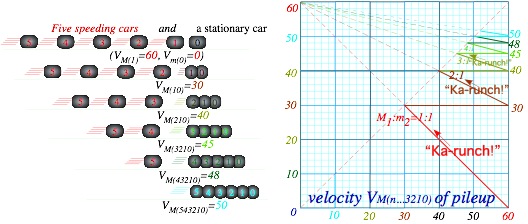
Fig. 8.6 Pile-up due to a line of five 60 mph cars hitting one stationary car
![]()
Fig. 8.7 A worse nightmare: Line of five 60 mph cars hitting five stationary cars.
An N-body model of rocket propulsion can be made by “time-reversing” pile-ups. Let us imagine a line of N=11 equal (m=1)-masses separated by explosive charges that go “pow!” in just the right sequence to blow one fuel-pellet at a time backwards off the rear end of a rocket and propel the remaining rocket mass forward.
Fig. 8.8 is a velocity-velocity plot of seven such “pow!”-blasts after which a rocket with just three masses numbered 8, 9, and 10 speeds off the page to the right. Presumably, the payload of this rocket is the ball labeled 10 at the head of the line. For N=11 balls, there are ten pow(b)-blasts numbered by b=0 to 9.
The velocity unit in Fig. 8.8 is the relative exhaust velocity Δve=-1 of each pow(b)-blast. The 0th-blast at the bottom of Fig. 8.8a starts with eleven stationary balls and blows ball-0 away from the line of ten balls 1-2-3…8-9-10. To conserve momentum (initially zero) the 10-ball rocket of mass (M=10m=10) has final velocity ΔVM=+1/10 to cancel momentum DP0=m·Dv0=-1 of fuel-pellet ball-0 in a zero-sum pow(0)-blast.
m·Δv0+10m·DVM(0)=0 (8.7a)
The 0th-blast line begins at the origin (VM=0,ve=0) of the VM-ve-plot in Fig. 8.8b and extends one unit down and 1/10th unit right to point (VM(0)=1/10,ve=-1). Pow(0)-line slope is mass ratio (-m/M=-1/10). It is a COM line of a time reversed totally inelastic collision. (You might call it a super-elastic collision.)
The 0th,1st,2nd,3rd,…, or 9th blast blows off fuel pellet-ball b=0, 1, 2, 3…, or 9, respectively. Each blast gives a larger rocket velocity boost ΔVM(1)=1/9, ΔVM(2)=1/8, DVM(3)=1/7…ΔVM(b)=1/(10-b) since rocket mass is less by m=1 after each blast but the exhaust momentum impulse m·Dve=-1 is the same each time.
m·Δv1+9m·DVM(1)=0 m·Δv2+8m·DVM(2)=0 … m·Dvb+(10-b)m·DVM(b)=0 (8.7b)
The harmonic progression 1/10,1/9,1/8…1/5,1/4,1/3,1/2,1 in Fig. 8.8a contains momentum impulse terms ΔVM(b) in a 10-term harmonic series 1/10+1/9+1/8…1/5+1/4+1/3+1/2+1. Rocket velocity after its bth pow(b)-blast is a partial sum of the first b+1 harmonic terms. The (VM ,ve)-plots in Fig. 8.8b show this.
0th: V(0)=1/10=0.1 1st: V(1)=1/10+1/9=0.211 2nd: V(2)=1/10+1/9+1/8=0.336
3rd: V(3)=V(2)+1/7=0.478 4th: V(4)=V(3)+1/6=0.646 5th: V(5)=V(4)+1/5=0.846
6th: V(6)=V(5)+1/4=1.096 7th: V(7)= V(6)+1/3=1.429 8th: V(8)=V(7)+1/2=1.929
On its 9th and final pow(9) the rocket is boosted by a whole unit exhaust velocity to V(9)=V(8)+1=2.929.
A 10-blast rocket exceeds exhaust velocity (|ve|=1) on its 6th pow(6)-blast with V(6)=1.096. This is labeled in extreme lower right hand side of Fig. 8.8b. In COM frame, exhaust mass 6 thru 9 end up moving forward but in rocket frame each exhaust mass leaves moving backward at exactly ve=-1 until another blast-boost hits the rocket. Exhaust masses numbered 0-9 separate from each other and from payload mass-10. Total COM momentum is always zero, and so all eleven balls always “balance” at COM origin.
N-blast velocity is a logarithm function if N is large. Momentum is still conserved for each blast.
M·ΔV=-ve·DM becomes: M·dV=-ve·dM or: ![]() (8.8a)
(8.8a)
We integrate this from initial rocket mass MIN to final payload MFIN and from rocket VIN to final VFIN.
![]() becomes:
becomes: ![]() (8.8b)
(8.8b)
This is the famous rocket equation. (Its predictions discourage interstellar travel. See exercises.)
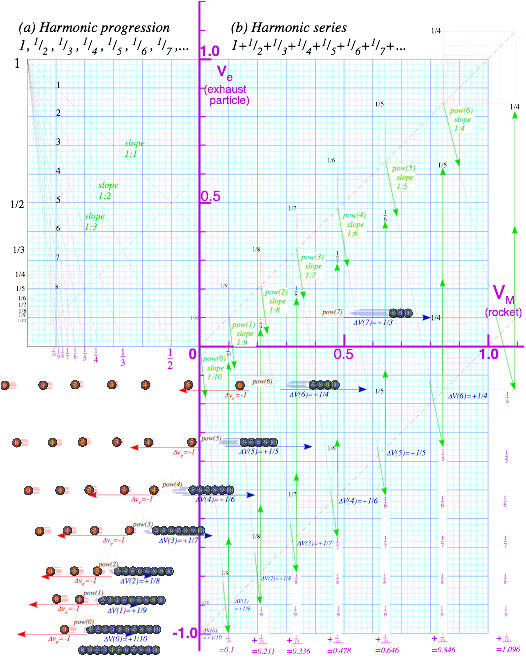
Fig. 8.8 Rocket science by harmonic series geometry.
Physical and geometric aspects of elementary force and potential fields are introduced in this section. The two most important are the oscillator and Coulomb fields that will later occupy Units 4 and Unit 5.
The most common power-law potentials are U(x) = Ax2 (Oscillator potential) in Fig. 9.1, U(x) = Ax (Uniform field potential) , and U(x) = Ax-1 (Coulomb potential) shown later. Power-law potentials and force laws have simple closed geometric constructions. Exponential or logarithmic fields (shown later) do not.
Multiplicative power operations are done using a staircase of similar triangles as shown in Fig. 9.2. A geometric progression {1=s0, s=s1, s2, s3,…} and an inverse progression {1=s0, 1/s=s-1, s-2, s-3,…} lie on either side of the unit stair step 1=s0. A slope or scale factor s=2 or s=1/2 is used in Fig. 9.2a or Fig. 9.2b. They resemble perspective drawings of school hallways. (Elementary School is (a) and High School is (b).) Each stair zigzags between slope-1 line-(y=x) and slope-s line-(y=s·x) or between line-(y=-x) and line-(y=x/s). The line-(y=s·x) and line-( y=x/s) are perpendicular or normal to each other. So are line-(y=x) and line-(y=-x).
A two-step triangle in Fig. 9.1a gives each point on the oscillator potential, a parabola y=x2. To find where the parabola hits vertical line-(x=2.2), for example, we go up that line to the 45° line-(y=x) and then go across to vertical line-(x=1). A dashed blue line is drawn from origin thru that point to an arrow intersecting line-(x=2.2) at pt-(x=2.2, y=2.22)on parabola-(y=x2). A similar zigzag gives pt-(x=-2, y=4) or any point on the parabola (y=U(x)=x2)below.
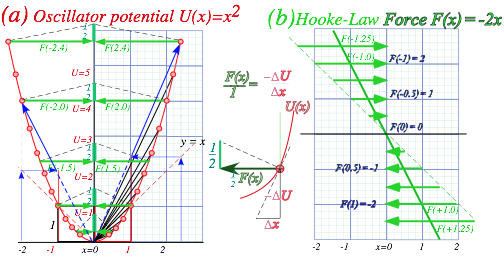
Fig. 9.1 Geometric construction of U(x)=x2 potential and Hooke’s force law F(x)=-2x.
The physicist Force =-Slope rule (6.9) is drawn using force triangles in Fig. 9.1a. Force is linear in x, that is, F=-2x, and that is minus the slope of x2. A line of slope –2 in Fig. 9.1b plots F(x). Force vector Fscaled by 1/2 gives a force vector shown in Fig. 9.1a equal and opposite to coordinate x. Each force triangle has base F/2, an altitude that is a constant 1/2, and a hypotenuse normal to the parabola tangent. It is similar to the tangent triangle with base DUand altitude Dx(center of Fig.9.1) that shows force=-slope(![]() ).
).
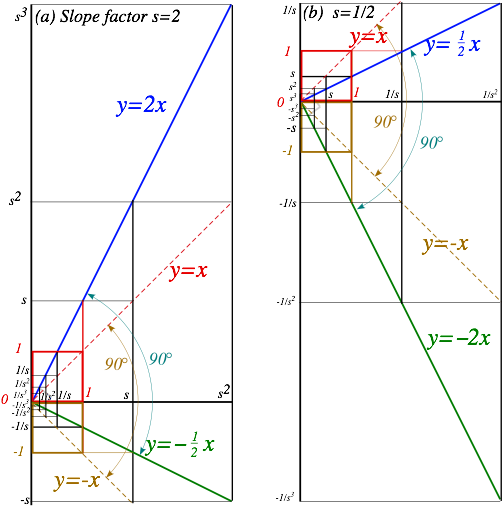
Fig. 9.2 Geometric sequences and “staircases” for slope or scale factor (a) s=2, and (b) s=1/2 .
A parabola U(x)=Ax2 has a focal point at y=U=A/4 where vertical rays meet if reflected by parabola tangents as in Fig. 9.3b. A parabolic radius is its half-width l at the focus. For y=x2 we have l=1/2. (Note how F(±0.5) vectors point at the focus in Fig. 9.1a.) An old name for l is latus rectum. A circle through the focus about any parabolic point will be tangent to a line called the directrix located at a distance lfrom the focus. Focus and directrix define a parabola that passes midway between them thru the tip-point M of the parabola where its focal radius and equal distance-to-directrix both reach their minimum value l/2.
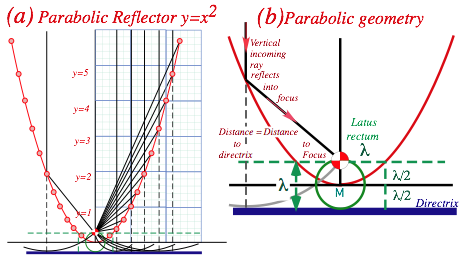
Fig. 9.3 Parabola and analytic geometry (a) Rays converging on focus. (b) l-geometry of tangent reflection.
Directrix is a so named because it “directs” both the rays and wave phase of an optical reflector. Since the focal radius (length of each sloping ray line in Fig. 9.3a) equals the perpendicular directrix distance (length of corresponding dashed vertical line), waves are guaranteed to be plane waves. Also, the equality of angle of incidence and reflection off the parabola bisecting the dashed and solid lines, guarantees vertical parallel rays for all which leave the focus and bounce off the inside of the parabola. It also guarantees that parallel vertical rays bouncing off the outside will go away from the focus. Either side of a parabolic surface converts plane waves to spherical ones or vice-versa.
To better understand the parabola’s geometric optics we draw examples of the tangent-kite for four different tangent slope values. The blue kite of slope=2 in Fig. 9.4a and yellow kite of slope=5/2 in Fig. 9.4b have equal focal radius and perpendicular distance-to-directrix forming the major iscosoles triangle of the kite. A minor iscosoles triangle (upside down in Fig. 9.4) shares a base with the major one. Their perpendicular bisector is the tangent line. The bisection point is slope![]() in units of l as indicated by vertical arrows.
in units of l as indicated by vertical arrows.
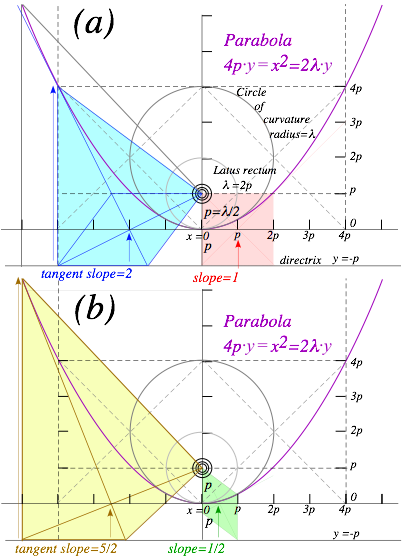
Fig. 9.4 Parabola and geometry of curvature and slope of tangent-kites.
A singular case is the red kite of slope=1 that is square. Lesser slope=1/2 gives a rhomboidal green kite with one side on the vertical parabolic axis instead of on the horizontal directrix. Points of slope=±1 on the (4py=x2=2ly)-parabola lie on either side of its focus at distance l=2p from it. l=2p is also the (minimum) radius of curvature of the parabola at its tip (minimum y at x=0) that lies a distance l/2=p below the focus.
Our atoms and molecules depend on the electrostatic Coulomb field to have stable chemistry and biology. Like charges repel and opposites attract with a force that varies inversely with the square of distance r between them. A simple version of the electric Coulomb force law (axiom) is:
![]() (9.1)
(9.1)
The units and notation are standard but the size of this is mind boggling. It’s nine billion Newtons for just two charge-units a meter apart. (To be precise it’s 8.99·109 Nm2/C2.) OK, a 1N is only about ![]() lb, but are you able to hold up a billion sticks of butter? Also, you have thousands of Coulomb charge units in each fingertip with only a centimeter separation so add another factor of (100)-squared. Make that ninety trillion Newtons for each Coulomb or about a million trillion Newtons trying their darndest to blow your pinkie to bits!
lb, but are you able to hold up a billion sticks of butter? Also, you have thousands of Coulomb charge units in each fingertip with only a centimeter separation so add another factor of (100)-squared. Make that ninety trillion Newtons for each Coulomb or about a million trillion Newtons trying their darndest to blow your pinkie to bits!
But, still we’re underestimating this monster force. Most of the electronic charge in the world is crammed into atoms and molecules with at most a nanometer (10-9 meter) across and some are an Angstrom (10-10 meter) or a tenth of a nano. So put on another factor of (10-9)-squared or million-billion trying to undo your pinkie, that’s a trillion-trillion-billion. Does your manicurist know about this?
Sometimes these forces get loose as in a TNT blast, but usually, tiny nuclei with an equal positive charge hold down potentially rebellious electrons. Still, what’s holding nuclei together? Nuclear radii are femto-meters (10-15 meter) or Fermi. (Note: both fm and Fm are abbreviations for 10-15m=10-13cm.)
Oops! That’s another factor of (10-15)2 or another million-trillion-trillion to increase our stress level. Nuclear charge is 105 times more pent-up than its atomic electronic counterpart with a grand total of about a trillion-trillion-trillion-trillion Newtons hankering to blow up your fingertip nuclei. Cancel the manicure!
When nuclei do blow up, the result is more than 105 times more devastating than TNT bangs. We don’t use force to estimate the devastation of a nuclear fission bomb or the yield of nuclear power plant fuel. Rather we use electric potential energy, that varies as 1/r not 1/r2. (Slope of a U(r)=1/r-curve is F(r)=1/r2.)
![]() (9.2a)
(9.2a)
Energy or(Force)-times-(distance)-unit is Joule or Newton. meter (N·m). Like superball potential field U(r) in (6.9), force F(r) (9.1) is a (-)derivative of potential U(r) that in turn is (-)integral of force F(r). (Recall (7.5.)
![]() (9.2b)
(9.2b)
![]() (9.2c)
(9.2c)
Potential nuclear energy yield is about a million times greater than for the same number of chemical energy sources since femto-meter nuclei are a million times smaller (RNUC~10-15) than nano-meter molecules (RMOL~10-9). Nuclear forces would then be a trillion times greater than typical atomic and molecular forces.
Fig. 9.5 plots attractive Coulomb force F(r)=-1/r2 and potential U(r)=-1/r of negative charge -q to a positve +Q nucleus. (Negative force points toward the +Q origin (x=0).) It uses zigzag geometry of Fig. 9.4.
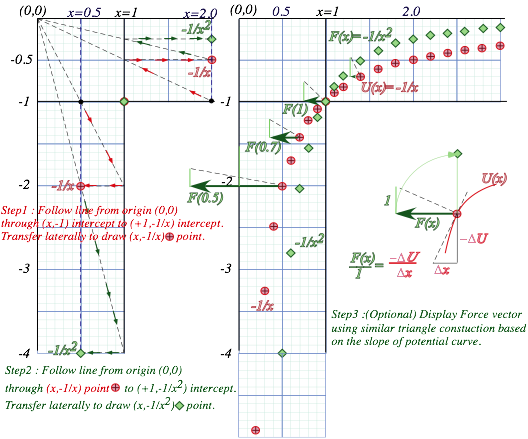
Fig. 9.5 Attractive Coulomb force F(x) and potential U(x) curves. (F(x) vectors drawn at 1/4-scale.)
Could the Coulomb F(r)~1/r2 force field be derived like the superball force F(Y)~1/Y3 in (6.10) by counting momentum bangs? Indeed, if a charge ejected a cloud of little “bang-balls” then the number of bangs scored at distance r would vary inversely with area 4πr2 of a radius r sphere. But, that idea doesn’t explain very well attraction of a charge +Q to a –q or of a mass M to a mass m in Newton’s gravity law.
Fgrav(r) = -GMm / r2 , where: G=0.000000000067 N m/kg2 (9.3)
Gravity is universally attractive (no “negative” matter readily available) but much weaker than the electric one since G constant 6.672E-11 (![]() in mks units) is smaller (by 1020 times!) than the
in mks units) is smaller (by 1020 times!) than the ![]() in (9.2).
in (9.2).
As of this writing it is still a mystery why these are so different. We really do not yet understand either of these forces at a fundamental level. They are still very much in the axiom box.
Imagine x=1 in Fig. 9.5 is the Earth radius RÅ=6.4E6m. The F(r) plot shows gravity falling off for r>RÅor x>1. But it’s wrong for subterranean radii (r<RÅ) unless Earth is compressed. F(r)=-1/r2 doesn’t apply everywhere unless Earth is squashed to a 10 millimeter radius “black hole.” (More on this later.)
If you were to be at sub-RÅ levels all Earth mass at radii above your radius r can be completely ignored in figuring your weight! As you might expect, you’re weightless at the center (r=0) since the pull of all Earth’s mass exactly cancels there. But, so also does your attraction to a spherical mass shell cancel anywhere inside it. One could float weightlessly anywhere therein regardless of the shell’s size or weight.
Such a cancellation is a geometric peculiarity of an inverse square law. (It also underlies a Gauss law explanation of why you’re safe inside a car struck by lightning.) Any direction you look inside a uniform mass shell has a mass element m whose force is cancelled by another element M behind. (See Fig. 9.6.)
The shell tangent to the m-point you’re facing intersects the tangent to the M-point behind you to make an isosceles triangle whose sides make an angle Q with your line of sight along the base. This means a narrow cone of sight will include shell mass m=Ad2 at a distance d in front of you and shell mass M=AD2 at a distance D directly behind you, where the angular factor A~1/sinQ is the same for both. That assures perfect cancellation of gravity m/d2 in front with -M/D2 behind you. This applies for all directions in Fig. 9.6.

Fig. 9.6 Equal-opposite attraction. Geometry for you floating weightless inside a spherical shell.
A mass m at radius r inside Earth feels gravity attraction GmM</r2 where M< is Earth mass inside the radius r indicated by the dashed circle in Fig. 9.6. If Earth is uniform density r, then that inside-mass is M<=4 rπr3/3. Force law r-2 cancels all but one r of the r3 in mass M<. We then get a linear force law.
Finside(r)=GmM</r2=m(G4πr /3) r=mg(r/RÅ)=mgx (9.4a)
(Earth surface gravity: g= G RÅ4πr /3=9.8ms-2) (9.4b)
The linear force law (9.4) is like that of a harmonic oscillator in Fig. 9.1b and so the inside-Earth potential must be a parabola like Fig. 9.1a. Force F(1)=-1 is continuous as we cross x=1 and so must be the slope of potential U(x) as U changes from –1/x2 to parabola. Terrestrial beings such as ourselves live in a nearly-constant-field (![]() )-region near x=1. In Fig. 9.7 we find the potential parabola geometrically by its focal point and directrix using the tangent at x=1. Recall a tangent at x=l=2p in Fig. 9.4a has slope=1 or 45°. So does the parabola at x=1 in Fig. 9.7 below have a slope of (+1) and a force of (-1) (That’s –mg in mks units.)
)-region near x=1. In Fig. 9.7 we find the potential parabola geometrically by its focal point and directrix using the tangent at x=1. Recall a tangent at x=l=2p in Fig. 9.4a has slope=1 or 45°. So does the parabola at x=1 in Fig. 9.7 below have a slope of (+1) and a force of (-1) (That’s –mg in mks units.)
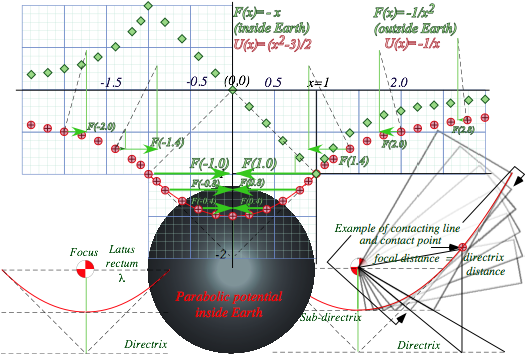
Fig. 9.7 Construction of Earth gravitational fields inside and outside.( units of x: RÅ,; F: mg; U: mgRÅ)
A parabola tangent bisects the angle between the line to the focus and the directrix drop-line as in Fig. 9.4. Twice 45° gives 90°. The focus is l=1.0 units straight across and the directrix is l=1.0 units below as shown in Fig. 9.7 (lower-left). Using this we may construct the parabola by rotating a square corner of a piece of graph paper around the focus so the corner touches a line halfway to the directrix. (We can call this half-way line the sub-directrix. It is the line of tangent intersections indicated by arrows in Fig. 9.4.)
The parabola so constructed is y=x2/2 –3/2. That is the interior potential UIN(x) (-1<x<1). It meets the curve y=-1/x that is the exterior potential UEX(x) (1<x<∞) at x=1where they are equal (UIN(1)=-1=UEX(1)) as is slope, which is the force (FIN(1)=-1=FEX(1)). (However, the slope of the force curve takes a big jump!)
Adding a constant to a potential won’t alter slope or force. We added ![]() to
to ![]() to make it equal
to make it equal![]() at x=1.
at x=1.
The “glue” that holds in the rebellious nuclear proton charge is called nuclear matter, a mix of neutrons, mesons, and their ingredients. Let’s imagine a fingertip (1cc) of neutrons as densely packed as they are in a nucleus or neutron star and estimate how such a neutron starlet might travel through Earth. First, we find the density of nuclear matter. Let’s say a nucleus of atomic weight 50 has a radius of 3 fm, so it has 50 nucleons each with a mass 2·10-27kg. (It’s actually more like 1.67·10-27, but roughly 2·10-27.)
That is 100·10-27=10-25 kg packed into a volume of 4π/3r3= 4π/3 (3·10-15)3 m3 or about 10-43 m3. That gives a whopping density of 10-25+43 = 1018kg per m3 or a trillion kilograms in the size of a fingertip.
That’s a pretty heavy fingertip! Its weight mg is ten trillion Newtons. (Well, actually 9.8 trillion Newtons. No need to exaggerate here!) In spite of this, its gravitational attraction to nearby rocks on the Earth is comparatively moderate. A (10cm)3 1kg rock would cling to the starlet with a force of about
Frock=Gm(1kg)/r2= 100Gm = 100(6.7E-11)1E12 = 6,700 N, (m=Mstarlet=1012kg)
or less than a ton and small change for a starlet weighing billions of tons and cutting into the Earth like a bullet going through cotton candy. Let’s see what speed it might gain falling from the surface.
Starlet energy is assumed constant since friction would be tiny compared to its enormous weight.
E = KE + PE = 1/2 m v2 + U(x) =1/2 m v2 + 1/2 mg (x2 –3)=const. (9.5)
Let it be released at Earth surface (x=1) with zero velocity. This sets the energy constant.
E =1/2 m02 + 1/2 mg (12 –3)=const.=- mg (9.6)
At Earth center (x=0) we solve for the velocity there. (The starlet mass m cancels out.)
E =1/2 mv2 + 1/2 mg (02 –3)=const.=- mg or: v2 = g , (9.7a)
v = √g (In mks units: v2 = gRÅ , or : v0 = √(gRÅ)=8 km/s) (9.7b)
v0 = 8 km/s is also Earth’s minimum orbital insertion speed. A mass dropped down the tunnel flies with the same x-coordinate as one shot with the speed v0 into circular orbit. One flies above the other and they meet each other on the other side 42 minutes later as shown in Fig. 9.8. We now show this synchrony of orbital timing holds for all pairs of starlets sent from anywhere inside the Earth!

Fig. 9.8 Neutron starlet penetrates Earth as satellite orbits to meet 1/2-way around in 42 minutes.
This synchrony involves a physicist’s most favored type of potential energy U=1/2kx2. When PE=U is a square like kinetic energy KE=1/2mv2 we have a wonderful symmetry between position x and velocity v.
E=KE +PE= const. = 1/2mv2 + 1/2kx2
We make any constant-sum-of-squares into a Pythagorian relation 1=sin2q+cos2 q just as we did to analyze the sum (5.10) of super-ball KE. Here (9.5) is a sum E=KE+PE and the constant k is starlet weight mg.
1=(m v2/2E) + (k x2/2E) =sin2q+cos2 q (9.8a)
Position x and velocity v are then expressed in terms sine and cosine of a phase angle q.
x= √(2E/k) sinq (9.8b) v= √(2E/m) cos q . (9.8c)
Velocity v is proportional to cosq and q has a constant angular velocity w=![]() so that q=wt+a. (a=q0=const.)
so that q=wt+a. (a=q0=const.)
![]() (9.9a) where:
(9.9a) where: ![]() (9.9b)
(9.9b)
Angle q is a polar angle in (x,v/w)-phasor-spaceof Fig. 9.10a. (x,v/w)-orbits are circular-clockwise (w=-|w|) if positive phasor v-axis is up and positive-xaxis is to the right. Earth xy-orbits may be elliptical with a polar angle fthat can orbit either way in Fig. 9.10. Each spatial dimension x and y has a constant sub-total energy.
KETotal=ey+ey where: ex=const.= 1/2mvx2 + 1/2kx2 and: ey=const.= 1/2mvy2 + 1/2ky2 (9.10)
Equal constants (ex=ey) give the circular orbit in Fig. 9.8. Frequency w(9.9) is independent of energy value ex or ey and so orbit and x-tunnel motion each have frequency w=√g, but tunnel motion, with same ex but zero ey, has half the energy. All motions of the starlet inside the Earth have the same 84-minute period. That is a fundamental harmonic period of a uniform Earth and approximates behavior of the real Earth.
To depict the force vector F on the starlet simply draw an arrow from it to origin as in Fig. 9.9a since F is proportional to coordinate vector -r. (In Fig. 9.7, F is equal to –r.) It’s projection on x or y-axes are the forces components driving the 84-minute oscillations along x or y-axes. Perhaps, there is a starlet deep below us swishing out 84-minute elliptical orbits as in Fig. 9.9b.
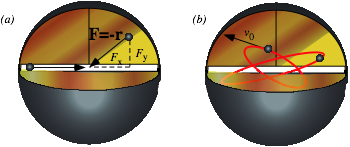
Fig. 9.9 Force and orbits inside Earth. (a) F is minus the coordinate vector (b) Typical orbits.
Imagine starlet-m has decayed to where it sits at the bottom of the U(x)=1/2mg(x2–3) curve in Fig. 9.7. How much energy does it take for it to escape from Earth center and go back whence it came? The plot of U(x) in Fig. 9.7 and discussions above suggest three equal steps of 1/2 that bring energy -3/2 at x=0 up zero at x=∞
Step-1 is to drag or shoot the starlet-m to the Earth’s surface. That takes energy DE1=1/2. (That’s 1/2mgRÅ in mks units.) Shooting radially at velocity v0 = √(gRÅ) given by (9.7b) would do this first step. It would then come to rest (momentarily) at the Earth surface at r=RÅ.
Step-2 is to launch starlet-m into a minimal circular orbit from the Earth’s surface. That takes dollop of energy ΔE2=1/2 equal to the first. (Again, that’s 1/2mgRÅ in mks units.) Shooting tangentially with minimum orbital insertion velocity v0 = √(gRÅ) given by (9.7b) does this second step.
Step-3 involves a final energy jump ΔE3=1/2 equal to each of the first two by increasing from the orbital insertion velocity v0 = √ (gRÅ) to the escape velocity Ve from Earth’s surface r=RÅ.
Ve= v0√2= √ (2gRÅ) =11.3 km/s=7 mile/s (9.11a)
In terms of fundamental potential Ugrav(RÅ)= -GMm /RÅ at a planets surface r=RÅ the escape velocity is
Ve= v0√2=√ (2GM/RÅ) . (9.11b)
Orbital threshold velocity v0of radius RÅ is √2=0.707 or about 71% of the escape velocity Ve from there.
By uniformly compressing Earth, we imagine extending the region of the Coulomb potential –1/r in Fig. 9.5 to lower values of r while making the harmonic potential U(r)=1/2kr2 inside the body occupy a smaller and smaller radius RÅ and take on narrower, deeper, and more negative energy values.
The plot in Fig. 9.5 maintains its shape but we rescale to accommodate a squashed Earth. The escape velocity in (9.11b) grows as we consider a decreasing squashed-planet radius RÄ. Finally there comes a particular radius RÄ where the escape velocity (9.11b) is the speed c of light.
c =√ (2GM/RÄ) (9.12a)
That radius is called the Schwarschild radius or “black hole” radius since light cannot escape.
RÄ= 2GM/c2 (9.12b)
For the earth of mass MÅ= 6·1024 kgthe radius RÄ is about nine mm, or the size of a fingertip. It is hard to imagine our world so squashed! Things may be collapsing all around, but please, not that much.
The oscillator functions in (9.8) suggest a coordinate-velocity plot or phase-space plot. By (9.9) the phase angle q=wt+ais a product of angular frequency w and time. To get a circle starting on the x-axis, we set initial phase to a=q0=p/2 and plot (x= X cos wt, v/ω= -X sin wt)for the “clock” or phasor plot in Fig. 9.10a.
So that positive v versus xdefines its 1st quadrant, a phasor rotates clockwise like a clock hand so angle q=-|w|t has a minus sign. (This is quite apropos since our clocks now are waves and harmonic oscillators.)
Each dimension x and y has its phasor plot as indicated by Fig. 9.10b. In other words there are four phase-space or phasor dimensions (x , vx/w , y , vy/w) being plotted. Here the frequency w for each dimension x and y is identical due to symmetry or isotropy of the Earth model. But, initial phases ax and ay of xand y are independent. In Fig. 9.10b we set x-oscillator phase to 2 o’clock (on a 16-hour clock) and y-oscillator 2 hours ahead to 4 o’clock so the ellipse orbit is clockwise and have a left-handed symmetry. Setting x to be 2 hours ahead of y makes the same orbit but it will go counter-clockwise and have a right-handed symmetry.
The x versus y plot with x always two hours or 45° behind y, is an inclined elliptical xy-orbit path in Fig. 9.10b. It might represent a typical neutron starlet path in the Earth. Or else, it might represent an optical polarization ellipse described in Unit 2. Below is a discussion of some special cases of orbit ellipses.
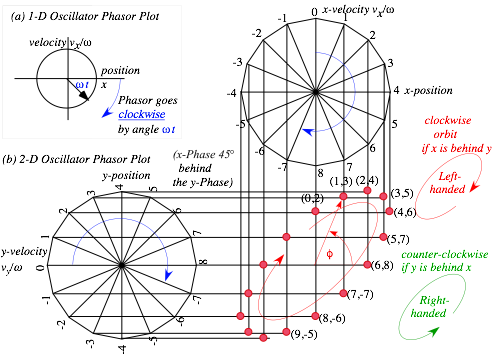
Fig. 9.10 Oscillator plots. (a) 1D-HO phasor plot. (b) Isotropic 2D-oscillator phasors and xy-path.
First we verify by algebra that orbits in Fig. 9.10 and Fig. 9.11 are ellipses. Fig. 9.11a has x running 90° behind y with a relative phase lag Da=ax-ay=p/2that is 4 hours or 1/4-period behind in phase on a 16-hour clock. We say such a 90°-lagging-x-motion is in-quadrature to y-motion. It gives an un-tilted ellipse with a left-handed orbit, and if ex=a=b=ey then it gives a circular orbit or left-circular polarization. (See Fig. 9.11a on right.) For right-handed orbits x-motion and x-motion switch leads to Da=ax-ay=-p/2.
In-quadrature xy -motion is a cosine and sine projection on a-side and b-side of an ellipse, respectively, based on expressions (9.8).
x = a cos w t , (9.13a) y = b cos(π/2-wt) = b sin wt . (9.13b)
Squaring and adding cosine and sine expressions gives a standard xy-ellipse equation.
![]() (9.13c)
(9.13c)
Zero phase lag Da =0 or in-phase motion gives linear polarization in Fig. 9.11b. In the case of Fig. 9.11b where x and y-motions are in-phase we have
x = a cos w·t , (9.14a) y = b cos w·t . (9.14b)
Combining these two gives a trajectory that follows a straight line of slope(b/a) seen in the figure.
y = (b/a) x (9.14c)
Lag Da =±por pi-out-of-phase is a linear polarized motion, too.
x = a cos w·t , (9.15a) y = -b cos w·t . (9.15b)
It is simply a horizontal mirror reflection of the in-phase path.
y =-(b/a) x (9.15c)
In each of the figures we could imagine three starlets going in unison. The first starlet obeys the y-equation (9.13b) with x=0. The second starlet obeys the x-equation (9.13a) with y=0 like the tunneling starlet in Fig. 9.8. A third starlet obeys both the x and y equations like the starlet orbiting above the tunneling one(s).
A linear force field F=-kr is the only field whose Cartesian components oscillate sinusoidally at the same frequency.
F=-kr implies : Fx=-kx , Fy=-ky , Fz=-kz (9.15)
Neither the coulomb field F=-kr/r3 nor any other power-law field F=-krrp is so convenient!
As shown in Unit 5, negative energy orbits in Coulomb fields are also elliptic, and elegant ruler & compass geometry gives them, too. However, Coulomb ellipses are symmetric about origin only for circular orbits. All other Coulomb orbits are eccentric since they orbit about an off-center focal point and not the ellipse center of symmetry that lies at origin (r=0) for any Hooke’s law oscillator orbit of a starlet.
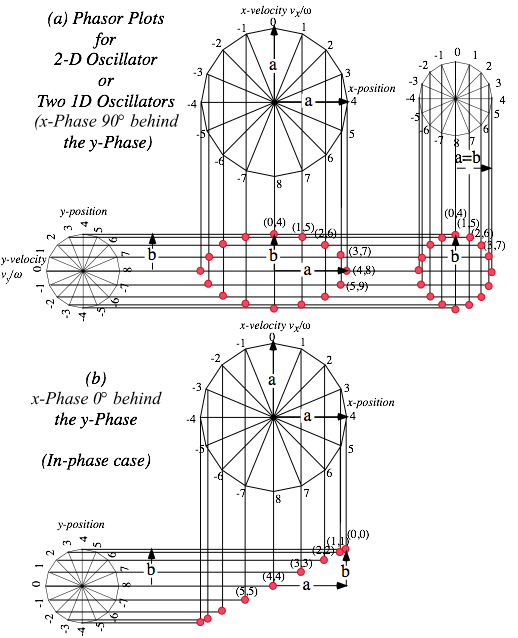
Fig. 9.11 Two 1-D oscillator phasor plots combine to give 2D-oscillator xy-trajectory.
A logarithmic potential curve U=ln(y)=logey was given by (6.11). Our first example is the flip or inverse exponential curve y=eU since that function is so important for making the complex phasor e-(iw+G)t.
Also, the population growth function y=et=exp(t) is one of the most used if not the most useful of transcendental functions. Roughly, transcendental means not expressed by finite algebra or constructed by Euclid’s strict rules. (However, like transcendental spirituality, it is easily approximated!) Later in this section we will prove that the exponential is the only function that is equal to its slope or derivative.
![]() (10.1)
(10.1)
In other words, if ex is a force or potential curve then F(x) and U(x) are similar, in fact, identical.
Fmath(x) ![]() = U(x). if and only if: U(x)=ex (10.2a)
= U(x). if and only if: U(x)=ex (10.2a)
For physicist’s definition (6.9) of force, e-x is the one for which potential and force are identical.
Fphys(x) ![]() = U(x). if and only if: U(x)= e-x (10.2b)
= U(x). if and only if: U(x)= e-x (10.2b)
For now we use these slope-function relations to construct the exponential curve approximately. Starting from origin (x=0) we use the fact that any positive number to zero power is 1. (e0=1) From that point we draw a right triangle made of a unit altitude, a unit base, and a hypotenuse line of slope-1 as indicated in Step-0 of Fig. 9.12. The hypotenuse line gives approximately the points just above and just below x=0. Then subsequent steps move the right triangle Δx to a point on the previously constructed line to make the next line. Since the slope is equal to the new function value, the base stays fixed at 1, but the altitude grows with the function value and makes the new line and a new point up the ex-curve.
This approximation is a rough one. It underestimates a concave curve and overestimates convex ones because it puts the next point x+Dx on a tangent from the previous point x. That’s OK only if the curve is pretty straight and tangent slope is about the same at x+Dx. A better approximation uses the tangent halfway between neighboring tangents and extends that new slope to x+Dx to find the next point.
Now if you rotate your y= ex-graph by90° you get a logarithm U(y)=-ln(y) graph as shown in Fig. 10.1 (lower right). Each U(y)-curve-normal defines a unit-altitude triangle whose base is the force F(y)=1/y.
Long ago banks would pay simple intrest at some rate r such as r=0.03 (3%) based on a 1 year period. You gave a principal p(0) to the bank and some time t later they would pay you p(t)=(1+r·t)p(0). If you put in $1.00 at rate r=1 (like Israel and Brazil that once had 100% intrest.) you got $2.00 at t=1year.
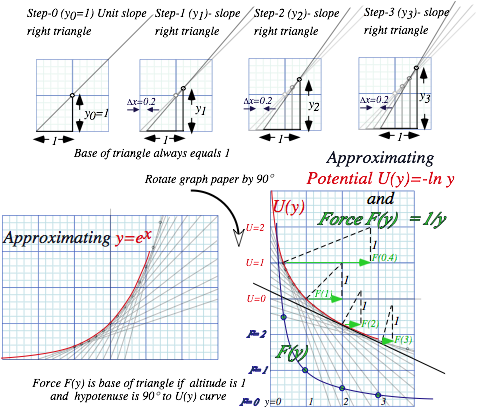
Fig. 10.1 Rough constructions (a) exponential curve y=ex=exp(x). (b) Log potential. (c) 1/y-Force.
Later on fancy banks would pay semester compounded intrest ![]() at the half-period
at the half-period ![]() and then use
and then use ![]() during the last half to figure final payment. Now $1.00 at rate r=1 earns $2.25.
during the last half to figure final payment. Now $1.00 at rate r=1 earns $2.25.
![]()
Fancier banks would pay trimester compounded interest ![]() at the 1/3rd-period
at the 1/3rd-period ![]() or 1st trimester and then use that to figure the 2nd trimester and so on. Now $1.00 at rate r=1 earns $2.37.
or 1st trimester and then use that to figure the 2nd trimester and so on. Now $1.00 at rate r=1 earns $2.37.
![]()
Still fancier banks would pay quarterly, monthly, weekly, daily, and so on. The race was on to give better earnings at a given interest rate r. Let’s compare some different earnings on $1.00 at rate r=1. At first it looks like you gain a lot by compounding more often. Then earnings slow to a halt just shy of $2.72.
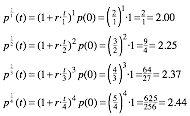
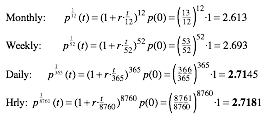
That halting point is Euler’s growth constant e=2.718281828459… that we’re after. Let's try huge numbers (m) of multiplications in ![]() . (Get out a calculator. Rule & compass is useless now!)
. (Get out a calculator. Rule & compass is useless now!)
p1/m(1) = 2.7169239322 for m = 1,000
p1/m(1) = 2.7181459268 for m = 10,000
p1/m(1) = 2.7182682372 for m = 100,000
p1/m(1) = 2.7182804693 for m = 1,000,000 (10.3)
p1/m(1) = 2.7182816925 for m = 10,000,000
p1/m(1) = 2.7182818149 for m = 100,000,000
p1/m(1) = 2.7182818271 for m = 1,000,000,000
The solid figures represent numbers that stay the same as we raise m. It’s still a torturous way to find e. We do a Billion (That’s “B” as in “Boy!”) multiplications (m=109) just to get 6 solid figures beyond 2.71.
A better way expands binomial ![]() or its power
or its power ![]() for all rates r and times t. We let mr·t=n and m =n/r·tto simplify it for huge multiplicationnumbers m or n.
for all rates r and times t. We let mr·t=n and m =n/r·tto simplify it for huge multiplicationnumbers m or n.
![]() (10.4)
(10.4)
A binomial expansion (See page 119) turns exponential function er·t into a power series in ![]() with x=1.
with x=1.
![]()
We actually save work as multiplication number n gets huge! (“Huge” means “as close to ∞ as you like.”)
![]()
Huge n makes n(n-1) cancel n2 , and n(n-1)(n-2) cancel n3 , and so on. The exponential er·t series is born.
![]() (10.5a)
(10.5a) ![]() (10.5b)
(10.5b)
Let’s try it out for r·t=1 to evaluate e to order-o. (The precision order o is the power of highest term used.)
Precision order: (o=1)-e-series = 2.00000 =1+1
(o=2)-e-series = 2.50000 =1+1+1/2
(o=3)-e-series = 2.66667 =1+1+1/2+1/6
(o=4)-e-series = 2.70833 =1+1+1/2+1/6+1/24
(o=5)-e-series = 2.71667 =1+1+1/2+1/6+1/24+1/120 (10.6)
(o=6)-e-series = 2.71805 =1+1+1/2+1/6+1/24+1/120+1/720
(o=7)-e-series = 2.71825
(o=8)-e-series = 2.71828
Nine terms in series (10.5) give 5-figure accuracy (10.6) and do the work of a million products in (10.3). That’s a million reduced to 8 sums and half-dozen or so divisions. It’s a big savings of arithmetic labor!
Binomial expansions provide ways to find calculus formulas for slope or velocity introduced geometrically in Ch. 1. Soon we will do the same for curvature or acceleration and other higher order calculus concepts.
Suppose someone gives you a plot of formula like x(t)=t2 or x(t)=sin4t or an exponential plot of x(t)=et that we just did in Fig. 10.1. You should be able to estimate its slope at any point from its x versus t graph. However, a binomial expansion may let you find an exact formula for its slope.
Consider a parabola x(t)=t2 for example. Let’s find the slope ![]() of a line that goes through point x(t) and a point x(t+Dt) =(t+Dt)2 that is a tiny time interval Dt later. Binomial expansion gives Dx=x(t+Dt)-x(t).
of a line that goes through point x(t) and a point x(t+Dt) =(t+Dt)2 that is a tiny time interval Dt later. Binomial expansion gives Dx=x(t+Dt)-x(t).
Dx=x(t+Dt)-x(t)=(t+Dt)2-t2=t2+2t·Dt+(Dt)2-t2=2t·Dt+(Dt)2
Slope ratio![]() follows. If Dt is tiny we ignore it. Then tangent slope
follows. If Dt is tiny we ignore it. Then tangent slope ![]() is the 1st derivative of x(t)=t2.
is the 1st derivative of x(t)=t2.
![]() (10.7a)
(10.7a) ![]() (10.7b)
(10.7b)
This checks the geometry of parabola 2ly=x2 in Fig. 9.4. Slope is ![]() , twice the x-value in units of 2l. Consider an n-power curve x(t)=Atn. Binomial expansion of Dx=x(t+Dt)-x(t) has n terms, most in +…+.
, twice the x-value in units of 2l. Consider an n-power curve x(t)=Atn. Binomial expansion of Dx=x(t+Dt)-x(t) has n terms, most in +…+.
Dx=x(t+Dt)-x(t)=A(t+Dt)n-Atn=Atn+Antn-1·Dt+…+A(Dt)n-Atn=Antn-1·Dt+…+A(Dt)n
If Dt is tiny, only 1st term Antn-1 in slope ratio![]() is not tiny-tiny. That 1st term is 1st derivative of x(t)=Atn.
is not tiny-tiny. That 1st term is 1st derivative of x(t)=Atn.
![]() (10.8a)
(10.8a) ![]() (10.8b)
(10.8b)
Series for x(t)=Aet is unchanged (for r=1) by ![]() . It does kill term number-∞, but
. It does kill term number-∞, but ![]() is tiny-tiny-tinyanyway.
is tiny-tiny-tinyanyway.
 (10.9)
For 100% intrest (r=1), growth rate-of-Aet equals Aet. Otherwise, growth rate of Aert is proportional to Aert. To state that the growth rate of a function x(t) equals a constant “intrest rate” rtimes current value of x(t)is to write a differential rate equation whose “solution” is x(t)=Aert. (The constant A is “initial capital” A=x(0).)
![]() (10.10)
(10.10)
It is Malthus’s population explosion equation for positive rate r>0! It is radioactive decay equation for r<0.
High school algebra courses generally contain a treatment of the binomial theorem that is used for our er·t expansion after equation (10.4). In case your course missed that (or you weren’t paying attention!) we’ll take a close look at this remarkable formula. The binomial algebra and related Pascal triangle geometry is the basis of so much mathematics and physics that it deserves a book chapter of its own.
First it helps to work out the first few binomial series (x+y)0, (x+y)1, ![]() (x+y)2, (x+y)3,… by simply multiplying them together as we did for the er·tseries that started this discussion. The first examples (x+y)0=1 and (x+y)1=x+y are easy since the 0th and 1st powers of a number n are defined to be 1 and n, respectively. The square of a binomial is simple enough, too.
(x+y)2, (x+y)3,… by simply multiplying them together as we did for the er·tseries that started this discussion. The first examples (x+y)0=1 and (x+y)1=x+y are easy since the 0th and 1st powers of a number n are defined to be 1 and n, respectively. The square of a binomial is simple enough, too.
(x+y)2=(x+y)·(x+y)=x2+xy+yx+y2= x2+2xy +y2 (1)
You might find it helps to make a table of product terms to do algebraic multiplication of this sort. Just make a box and write one factor ((x+y) in this case) on top and the other ((x+y) again) along the left.
![]()
 (2)
(2)
The just multiply each thing on top by each thing on the left and add them up to get (1). Try it with (x+y)3.
 (3)
(3)
We can continue this process to get (x+y)4, (x+y)5,…and so forth.
 (4)
(4)
 (5)
(5)
After awhile, you might notice a pattern in the numbers or coefficients Bpqof the various power terms xpyq where the powers p and q must add up to the power n=p+q of (x+y)n being calculated. These Bpq are called the binomial coefficients of xpyq and a triangular array pattern in Fig. 1 is called Pascal’s triangle.
This pattern is like a Ponzi scheme since every number in it except the pinnacle B00=1 is the sum of one or two numbers that lie above it and to either side. (This sum is going on in (2) thru (5) above.) So the pinnacle position q-p=0on the central vertical triangle axis ends up with the biggest number Bpq for each power-row n=p+q. At n=p+q =10throw, pinnacle B5,5accumulates 252from 11 spots –5<q-p<+5.
Table 1. Binomial combinatorial coefficients up to power n=10
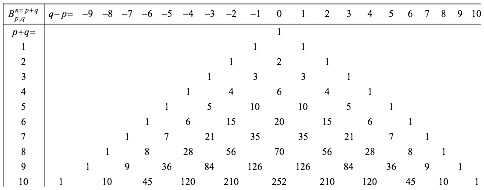
Gamblers may recognize B55=252as the number of ways you can get exactly 5x-cards and 5y-cards from an n=20 card deck of 10 x-cards and 10y-cards. More simply, B55=252 is the number of ways to get exactly 5 heads and 5tails from an n=10coin tosses, or x5y5 from an (n=10)-power binomial.
(x+y)(x+y)(x+y)(x+y)(x+y)(x+y)(x+y)(x+y)(x+y)(x+y)=(x+y)10=x10+…252x5y5+…y10 (7)
As you go down the line of 10 factors (x+y) you must pick x or yfrom each factor (x+y)to make just one (n=10)-power term xpyq with n=p+q. There are 210 =1024 such terms. (Just add up the 10th row of Table 1.)
(1+1)10=210=110+…252·1515+…=1+10+45+120+210+252+210+120+45+10+1=1024 (8)
Check the other rows, too. (It’s a good to know powers-of-2 in a binary age!)
22=4, 23=8, 24=16, 25=32, 26=64, 27=128, 28=256, 29=512, 210=1024,… (9)
Now suppose, instead of just two things x or y, you could choose n different things {a,b,c,…,x,y,z,..}from each of the nfactors in (7). Then the number of ways you may get a given term a·b·c·…·x·y·z·.. having all ndifferent things is the number n!=n·(n-1)·(n-2)·…·2·1of permutations of nthings. Each permutational reordering gives another equal term (a·b=b·a).
So, n! is the “n-nomial coefficient” for a term with n-different factors. However, if we are counting terms xpyq like a binomial series has with only two different things, the p!permutations of the xthings and the q! permutations of the y things do not count as new terms. Then n! divided by p!and q! gives Bpq.
![]() examples:
examples: ![]()
This gives binomial series that follows (10.4) and the Gauss-binomial distribution plotted below.

Are power series like (10.5) useful for functions other than exponentials? Well, Mr. Maclaurin and Mr. Taylor thought so. Series that bear their names are de rigeur in good math books. (And, in this one, too!)
Let’s start with a general power series like (10.5) but with arbitrary constant coefficients c0, c1, etc.
![]() (10.11a)
(10.11a)
We derive c0by setting time t to an initial time t=0. (Like C-programmers, we count “uh-zero, uh-one, uh-two,..”)
c0 = x(0) (10.11b)
So the 0th coefficient c0 is initial position x(0). Now we use (10.8b) to find a derivative of each term.
![]() (10.11c)
(10.11c)
Rate of change of position x(t) is velocity v(t). Setting t=0 derives c1.
c1 = v(0) (10.11d)
So the 1st coefficient c1 is initial velocity v(0). Now find a 2nd derivative using (10.8b).
![]() (10.11c)
(10.11c)
Change of velocity v(t) is acceleration a(t). Set t=0 to get c2.
c2 = ![]() a(0) (10.11d)
a(0) (10.11d)
So the 2nd coefficient c2 is half the initial acceleration a(0). Now a 3rd derivative:
![]() (10.11e)
(10.11e)
Change of acceleration a(t) is jerk j(t). (Jerk is a NASA sanctioned term!) Set t=0 to get c3.
c3 =![]() j(0) (10.11f)
j(0) (10.11f)
So the 3rd coefficient c3 is initial jerk j(0) over 3! Now a 4th derivative:
![]() (10.11g)
(10.11g)
Change of jerk j(t)is inauguration i(t). (If NASA can be silly, so can we!) Set t=0 to get c4.
c4 =![]() i(0) (10.11h)
i(0) (10.11h)
So the 4th coefficient c4 is initial inauguration i(0) over 4!. Now a 5th derivative.
![]() (10.11i)
(10.11i)
Change of inauguration i(t) is revolution r(t). (Ooops! Politically incorrect!) Quick set t=0 to get c5.
c5 =![]() r(0) (10.11j)
r(0) (10.11j)
That’s enough iterations to show the Maclaurin series of any function x(t) that has decent derivatives.
![]() … (10.12a)
… (10.12a)
By “decent” we mean the non-exploding types that we can deal with. The following is a list that shows some of the notations used for the higher order derivatives discussed so far.
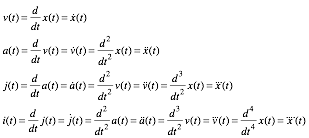 (10.12b)
The “dot” notation writes n-derivatives of x(t) by puttting n-dots over x. This may help prevent writer’s cramp. But, j-dot looks, well, kind of jerky. It’s common to use primes (![]() ) for x-derivatives.
) for x-derivatives.
How good is a power series (10.5) at faking x=et beyond t=1listed in (10.6)? We plot various orders of approximation in Fig. 10.2. The 1st order (2-terms of (10.5a)) is just a straight line of slope 1. A 2nd order (3-term) parabola, 3rd order cubic, 4th order quartic, etc. each peel off x=et in sucession. All meet at (t=0,x=1).
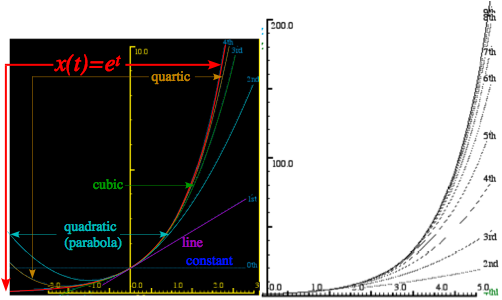
Fig. 10.2 Comparing x=et with its nth-order approximate power series.
A severe test of power series is their ability to fake sine waves. The derivative and rate equation for the sine function x(t)=sinwtuses expansion x(t+Δt)=sinw(t+Dt). To expand sin(a+b) or cos(a+b) we use Fig. 10.3.
sin(a+b)= cosa sinb + sina cosb (10.13a) cos(a+b)= cosa cosb - sina sinb (10.13b)
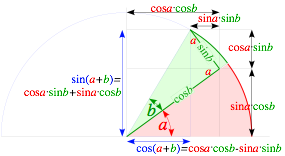
Fig. 10.3 Geometry of sine and cosine expansion identities.
Expansion of Dx=x(t+Dt)-x(t) for sine or cosine is easy since sinw·Δt=w·Δt and cosw·Dt=1 for tiny Δt.


![]() (10.14a)
(10.14a) ![]() (10.14b)
(10.14b)
We will need the sine and cosine slope (derivative) formulas that follow from this.
![]()
![]()
![]() (10.15a)
(10.15a) ![]() (10.15b)
(10.15b)
A list of series coefficients![]() in (10.12) for sine x=sin wtand cosine x=cos wtis worked out below.
in (10.12) for sine x=sin wtand cosine x=cos wtis worked out below.
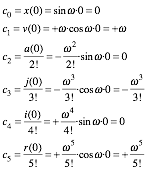
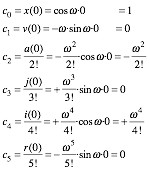
A sine derivative repeats after four orders: …sin t, cos t, -sin t, -cos t, (again) sin t, cos t, -sin t, -cos t, (etc.).
The resulting sine and cosine series show this repeat-after-4-pattern of factors 0,1,0,-1 of ![]() terms.
terms.
![]()
![]()
(10.16a) (10.16b)
The sine is an odd function to time reversal (sin(-t) =-sin(t)), but cosine is even (cos(-t) =+cos(t)). Thus sine has only odd powers p=1,3,5,… of time and cosine has only even powers p=0,2,4,…. Series plots (10.16) in Fig. 10.4 have highest power or order o=1st,2nd,3rd,4th,etc. Number nof terms is ![]() for sine and
for sine and ![]() for cosine.
for cosine.
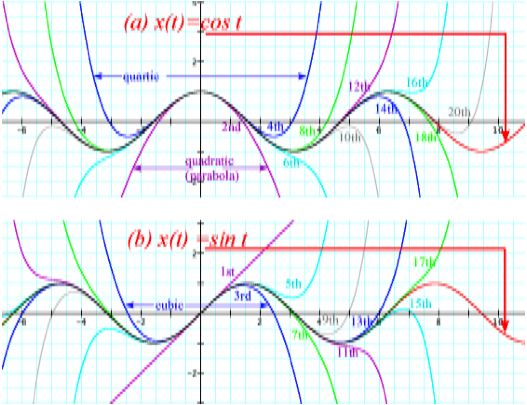
Fig. 10.4 Comparing (a) x=sin t and (b) x=cos t with their nth-order approximate power series.
It takes a 9th (for sin t) or 10th(for cos t) order series of 5 terms to get one full oscillation with 5% or better precision. Then 10 terms gives two oscillations, and so on. Fig. 10.4 shows that precision breaks down quite explosively. Polynomials are exponentially degrading approximations of wave motion.
Sine, cosine, and ert power series (10.16) and (10.9) lead to an 18th Century crown jewel of mathematics. It is due to a close relation of these series and the functions they represent. It is hard to imagine, but exponential intrest rate growth and simple harmonic oscillation are related. As it turns out, the relation is quite imaginary!
Suppose the fancy bankers really went bonkers and made intrest rate r an imaginary number r=iq. Imaginary number ![]() has powers with a repeat-after-4-pattern: i0=1, i1=i, i2=-1, i3=-i, i4=1,etc... It fits the pattern leading to cosqand sinqseries (10.16). Series (10.9) with imaginary rt=iqjoins the (10.16) series.
has powers with a repeat-after-4-pattern: i0=1, i1=i, i2=-1, i3=-i, i4=1,etc... It fits the pattern leading to cosqand sinqseries (10.16). Series (10.9) with imaginary rt=iqjoins the (10.16) series.

![]() (10.17)
(10.17)
The resulting Euler-DeMoivre Theorem is a beautiful identity and a very powerful tool as we shall see. First and foremost it is a complex wave phasor function ![]() that we will use in Unit 4. (Note: q =-w·t.)
that we will use in Unit 4. (Note: q =-w·t.)
![]() (10.18)
(10.18)
Fig. 10.5a plots ![]() in the complex plane, a real-vs-imaginary graph. Fig. 10.5b shows
in the complex plane, a real-vs-imaginary graph. Fig. 10.5b shows![]() as a complex phasor clock. Real part Rey =x(t)is position. Imaginary part is w-scaled velocity Imy =v(t)/w. Conversion of polar-to-Cartesian (10.19a) and vice-versa(10.19b) is on scientific calculators. (Recall cautions at end of Ch. 1.)
as a complex phasor clock. Real part Rey =x(t)is position. Imaginary part is w-scaled velocity Imy =v(t)/w. Conversion of polar-to-Cartesian (10.19a) and vice-versa(10.19b) is on scientific calculators. (Recall cautions at end of Ch. 1.)
![]() (10.19a)
(10.19a) ![]() (10.19b)
(10.19b)
Real part Rey is the “is” (that Clinton sought in 1997) and Imy is what Rey is “gonna-be” in![]() -cycle (as in “gonna be in trouble!” A mantra,“Imagination precedes reality by one quarter” works here as in US corporate world.) Euler expo-sinusoidal identities relate cosq, sinq, and e±iq. A conjugate y* reflects iwith –i.
-cycle (as in “gonna be in trouble!” A mantra,“Imagination precedes reality by one quarter” works here as in US corporate world.) Euler expo-sinusoidal identities relate cosq, sinq, and e±iq. A conjugate y* reflects iwith –i.
![]() (10.20a)
(10.20a) ![]() (10.20b)
(10.20b)
A special case is e-iπ=-1. (We’ll also use a real π-exponential: e-π=0.04321.) Other special cases are noted.
![]() ,
, ![]() ,
, ![]() . (10.21)
. (10.21)
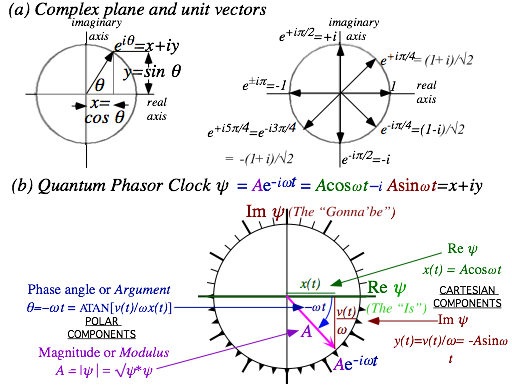
Fig. 10.5 (a) Complex plane. (b) Phasor clock. Cartesian form uses (Rey, Im y). Polar form uses (|y|,q).
By now bankers should know what happens when you use imaginary intrest. The accounts oscillate up and down and the imagineering bankers oscillate in and out of the slammer. (At least that was the way until 2001 when the Bush administration passed the No Banker Left on His Behind Act that also outlawed reality.)
Consider exponential rate equation (10.15) with negative imaginary rate r=-iw.
![]() (10.22a)
(10.22a)
It becomes a real 2nd order equation if we apply the derivative operation to both sides.
![]() (10.22b)
(10.22b)
It is the Newton-Hooke simple harmonic oscillator equation, but it has the same solution as (10.19) above.
![]() (10.23a)
(10.23a)
It combines Newton’s force law F=m·a=m![]() and Hooke’s force law F=-k·x. The wvalue repeats (9.9b).
and Hooke’s force law F=-k·x. The wvalue repeats (9.9b).
![]() (10.23b)
(10.23b)
Complex Exponentials are used to describe oscillation, resonance, waves and fields. We don't use them just to be cute! Let’s look at some compelling reasons for using imaginary or complex arithmetic.
If you have trouble remembering trigonometric identities then this is a good reason all by itself to use complex numbers. For example, if you're taking a test and you can't remember what is cos(a+b), then just factor ei(a+b) = eiaeib, expand exponentials into eia = cos a + i sin a and multiply them out.
ei(a+b) = eiaeib
cos(a+b) + i sin(a+b) = (cos a + i sin a) (cos b + i sin b)
cos(a+b) + i sin(a+b) = [cos a cos b - sin a sin b]+i[sin a cos b + cos a sin b] (10.24a)
That’s two trig identities for the price of one! The real part gives the cosine relation (10.13b).
cos(a+b) = [cos a cos b - sin a sin b] (10.24b)
The imaginary part gives the sine relation (10.13a).
sin(a+b) = [sin a cos b + cos a sin b]. (10.24c)
Recall discussion of phasor diagram in Fig. 10.5b. Real and imaginary give phase: position and velocity.
Physics of wave interference involves the addition or subtraction of oscillating signals. If the signals are represented by complex numbers then you simply add (or subtract) their Cartesian components.
zsum = z + z' = (x + iy) + (x' + iy') = (x + x') + i(y + y')
zdiff = z - z' = (x + iy) -(x' + iy') = (x - x') + i(y -y')
Before adding, convert z a z' to Cartesian (x,y) form if given in polar form z=reif and z'=r'eif'. Radius r of a vector z is its magnitude or complex absolute value |z|. Square |z|2 is proportional to energy or intensity.
|z| = r = √(x2 + y2) = √([x - iy][x + iy]) = √(z*z)
We write |z|2 as product of z and its complex conjugate z* = x - iy =re-if to derive radius |zsum| of a vector sum zsum or radius |zdiff| of a difference zdiff. It is an easy way to get the well-known cosine laws.
 (10.25a)
![]() (10.25b)
(10.25b)
Vector diagrams of sum, difference, and product of complex z and z¢are shown in Fig. 10.6.

Fig. 10.6 Parallelogram diagonals are sum zsum=z+z' and difference zdiff=z-z' vectors.
A product zz' of two complex numbers expressed in Cartesian form as z = x + iy and z'= x'+ iy' is
z z' = (x + iy) (x' + iy') = [xx' - yy'] + i[xy' + yx'].
It is simpler if the numbers are expressed in polar form as z = r eif and z' = r' eif'.
z z' = ( reif )( r'eif' ) = r r' ei(f+f'). (10.26)
Note that multiplication results in addition of exponents and a sum of polar angles. Radii multiply to give a product rr' but angles add to give a sum (f + f'). You might imagine z rotating vector z' by φ radians or that z' rotates z by φ' radians. Consider in detail a rotational operator eif on a vector z =(x + iy).
eif·z = (cosf+ i sinf)·(x + iy)= x cosf-y sinf+ i(x sinf+ y cosf) (10.27a)
Ch. 5 2-by-2rotation matrix Rf (Fig. 5.3d) acts on a 2D vector r to give results precisely similar to eif·z.
![]() (10.27b)
(10.27b)
![]() (10.27c)
(10.27c)
Phase angle -wt of phasor e-iwt rotates clockwise with time. Multiplying e-iwt by a complex amplitude A =|A|eir sets its phase back by angle ρ and its radius to |A|. Amplitude A is the initial value x(0)=|A|eir.
x(t)=Ae-iwt = x(0)e-iwt = |A|eire-iwt = |A|e-i(wt-r) (10.28)
Such products set initial values of oscillator clocks. A positive angle r is a phase lag since it moves the phasor counter-clockwise and sets its clock back. A negative angle r=-|r| gives a phase lead.
Consider any two vectors A=Ax+iAy and B=Bx+iBy and their “star” (*)-product A*B.
![]() (10.29)
(10.29)
Real part is scalar or “dot”(•) product A•B. Imaginary part is vector or “cross”(´) product, but just the Z-component normal to xy-plane. To better understand this math trickery, we rewrite A*Bin polar form.
![]() (10.30a)
(10.30a)
This matches standard 3D definitions of dot(•) and cross(´) products in Appendix 1.A of this Unit.
![]()
![]() (10.30b)
(10.30b)
Expansion (10.24) of Δ-angle ![]() relates reiq forms (10.30) to xy-forms in (10.29).
relates reiq forms (10.30) to xy-forms in (10.29).
![]()
![]()
![]() (10.30c)
(10.30c) ![]() (10.30d)
(10.30d)
By relating (z,z*) to (x=Rez,y=Imz) we may define a z-derivative![]() and “star” z*-derivative
and “star” z*-derivative![]() .
.
![]()
![]()
![]() (10.31)
(10.31)
Derivative chain-rule shows real part of ![]() has 2D divergence ∇•Fand imaginary part has curl Ñ´F.
has 2D divergence ∇•Fand imaginary part has curl Ñ´F.
![]() (10.32)
(10.32)
Now we can invent source-free 2D vector fields that are both zero-divergence and zero-curl by taking any function f(z) and conjugating it (change all i’s to –i) to give f*(z*)for which ![]() . For example, if f(z)=a·z then f*(z*)=a·z*=a(x-iy) is not a function of z so it has zero z-derivative, hence zero ∇•Fand zero |Ñ´F|.
. For example, if f(z)=a·z then f*(z*)=a·z*=a(x-iy) is not a function of z so it has zero z-derivative, hence zero ∇•Fand zero |Ñ´F|.
F=(Fx,Fy)=(f*x,f*y)=(a·x,-a·y) has zero divergence: Ñ•F=0 and has zero curl: |Ñ´F|=0. (10.32)
A plot of vector field F=(f*x,f*y) =(a·x,-a·y)in Fig. 10.7 shows a divergence-free laminar (DFL) flow field.
Any DFL flow field F is a gradient of a scalar potential field F or a curl of a vector potential field A.
F= ∇F F= Ñ´A
There is a complex potential f(z)=F(x,y)+iA(x,y) whose z-derivative is f(z) and it comes with its complex conjugate f*(z*)=F(x,y)-iA(x,y) whose z*-derivative is the f*(z*) that we use to plot DFL flow fields F.
![]() (10.33a)
(10.33a) ![]() (10.33b)
(10.33b)
Derivative ![]() by (10.31) has 2D gradient
by (10.31) has 2D gradient ![]() of scalar F and curl
of scalar F and curl ![]() of vector A.
of vector A.
![]() (10.34)
(10.34)
Some more math trickery has “vector-A” be just a “Z-component” A=Azez normal to the complex (x,y)-plane. So A(x,y)=Az(x,y) is treated as a single function of (x,y)like scalar F(x,y). Also, a mathematician definition for force field F=+ÑF replaces our usual physicist’s definition F=-Ñ of (6.9). (No annoying (-)-sign for us now!)
To find f=F+iA we integrate f(z)=a·z to get f and isolate real (Ref=F) and imaginary (Imf=A) parts.
![]() (10.35a)
(10.35a)
Note: either part gives the whole F field. Factors ![]() in (10.34) could be
in (10.34) could be ![]() or
or![]() or any (f,j) with f+j=1.
or any (f,j) with f+j=1.
![]() (10.35b)
(10.35b) ![]() (10.35c)
(10.35c)
Scalar static potential lines F=const. and vector flux potential lines A=const. define a field-net in Fig.10.7.
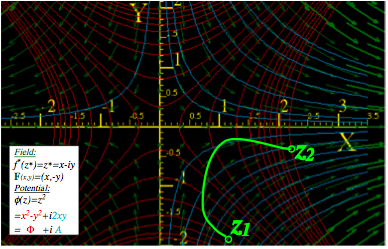
Fig.10.7 Complex field f(z)=zof F=(x,-y) vectors on potentials of static F=(x2-y2)/2and flux A=xy.
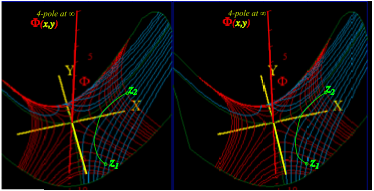
Fig. 10.8 Stereo-3D view of Fig. 10.7(f(z)=z2/2) plots static potential Fnormal to xy-axes.
Integral f(z) (10.35a) between point z1 and point z2 in Fig. 10.8 is potential difference Δf=f(z2)- f(z1) between the end-points. In DFL fields, Df is independent of the integration path z(t) connecting z1 and z2.
 (10.36)
The real part ΔF of Dfis work ![]() done pushing r up a hill in Fig. 10.8. (Now force F= ÑF points up-slope.) Since F=(f*x, f*y) is plotted using f*(z*), we set f(z)=(f*(z*))* to get real and imaginary parts of f(z)dz.
done pushing r up a hill in Fig. 10.8. (Now force F= ÑF points up-slope.) Since F=(f*x, f*y) is plotted using f*(z*), we set f(z)=(f*(z*))* to get real and imaginary parts of f(z)dz.
 (10.37)
Real part ![]() sums Fprojections along path vectors drto get ΔF in (10.36). Imaginary part
sums Fprojections along path vectors drto get ΔF in (10.36). Imaginary part ![]() sums Fprojection across drthat is, it sums flux thru surface elements dS=dr´normal to drto get ΔA.
sums Fprojection across drthat is, it sums flux thru surface elements dS=dr´normal to drto get ΔA.
One power-law field f(z)=aznlacks a power-law potential![]() . It is
. It is ![]() . Its integral is a logarithmic potential f(z)=a·ln(z)=a·ln(x+iy). (Recall (6.11).) Use ln(a·b)=ln(a)+ln(b), ln(eiq)=iq, and z=reiq.
. Its integral is a logarithmic potential f(z)=a·ln(z)=a·ln(x+iy). (Recall (6.11).) Use ln(a·b)=ln(a)+ln(b), ln(eiq)=iq, and z=reiq.
![]() (10.38)
(10.38)
Potential a·ln(z) is the field of a line of charge qif a=q is real and a line of current J if a=iJ is imaginary. Fig. 10.9a is a diverging F-field of unit charge (q=1) and Fig. 10.9b is a curling F-field of unit current (J=1). Line chargeF-field is like an electric E-field. Line current F-field is like a magnetic B-field of a wire. It is a vortex.
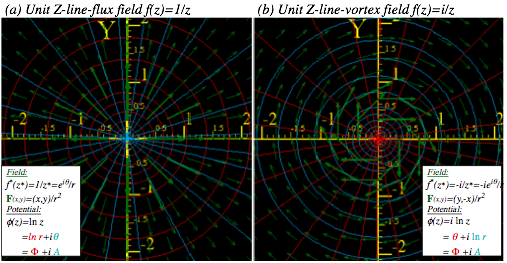
Fig. 10.9 Fields due to a unit Z-line-source normal to center. (a) Real source a=q=1. (b) Imaginary a=iJ=i.
F-field and radial streamlines (A=q =const.) diverge normal to equal-F circles (F=r =const.) in Fig. a. F-field and circular streamlines (A=r =const.) curl clockwise normal to radial equal-F lines (F=q =const.)in Fig. b. (The clockwise (-i)-sense of rotation results from plotting f*(z*)=-i/z*as our (*)-convention requires.)
Stereo-3D potential plots of real-line-source field shown in Fig. 10.10a show mathematical structure of its F and Apotentials that lets us compare them to imaginary-line-source potentials in Fig. 10.10b. Real part F=ln(r) of (10.38) for real (a=1)-source in Fig10.10a is a surface like a morning-glory. Blue-(A=q=const.) -streamlines stream down its throat normal to (F=r =const.) level circles.
Below that F-vs-(x,y)-plot is a 3D A-vs-(x,y)-plot for the same real source in Fig. 10.10a. Imaginary part A=qof (10.38) gives radial steps that are level lines of a single helix or helicoid. Red-(F=r =const.)-lines stream up its spiral staircase normal to (A=q=const.) steps. At the top step A=q=π , above the –X-axis, is a “waterfall” of red lines falling by ΔA=2πstraight to bottom helical stepA=q=-π. This 2πi-fall of complex potential f(z) by Δf=iΔA=2πi at q=±π equals the loop integral of f(z) from q=-π to q=+π.
![]() (10.39)
(10.39)
Imaginary part ΔA of a loop integral counts real source (“flux”) since loop flux is Im![]() in (10.37). Real part ΔF= Re
in (10.37). Real part ΔF= Re![]() counts imaginary source (“vorticity”) since only that makes work around a loop, that is, perpetual motion! In Fig. 10.10b, F and Aswitch roles to make imaginary-line-source-potentials.
counts imaginary source (“vorticity”) since only that makes work around a loop, that is, perpetual motion! In Fig. 10.10b, F and Aswitch roles to make imaginary-line-source-potentials.
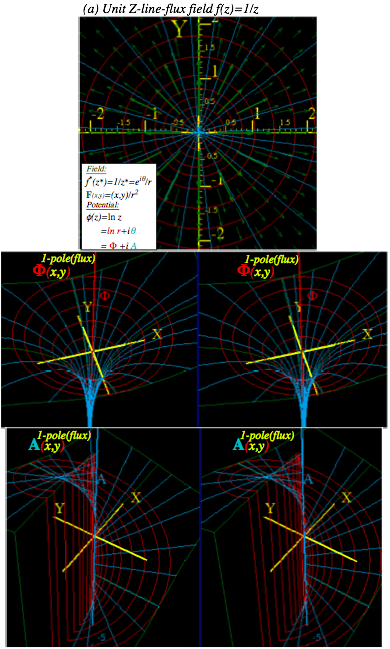
Fig. 10.10(a) Real unit line-source (a=1) with diverging F-field resembling E-field of electric line-charge.
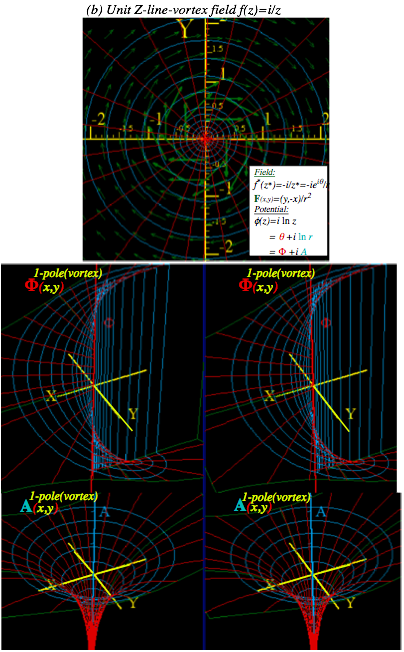
Fig. 10.10(b) Imaginary line-source (a=i) with curling F-field resembling B-field of electric line-current.
Of all integer-power-law field functions f(z)=zn of zonly a/z =az-1 has a non-power-law multi-valued integral and potential ![]() (10.38) and non-zero flux-work-loop integral
(10.38) and non-zero flux-work-loop integral ![]() (10.39). This special f(z)=az-1 is a 2D line monopole field and
(10.39). This special f(z)=az-1 is a 2D line monopole field and ![]() is its monopole potential of source strength a.
is its monopole potential of source strength a.
![]() (10.40a)
(10.40a) ![]() (10.40b)
(10.40b)
Now let these two line-sources of equal but opposite source constants +a and –a be located at z=±D/2thus separated by a small interval D. This sum (actually difference) of f1-pole-fields is called a dipole field.
![]()
![]()
If interval D is tiny and is divided out we get a point-dipole field f2-pole that is the z-derivative of f1-pole.
![]() (10. 41a)
(10. 41a) ![]() (10. 41b)
(10. 41b)
A point-dipole potential f2-pole (whose z-derivative is f2-pole) is a z-derivative of f1-pole. Pair (10. 41) looks like a Coulomb force (9.1) and potential (9.2) of 3D point monopoles. However, 2D dipole field (10. 41a) is quite different as is 2D potential (10. 41b) whose F=const. and A=const. lines make a circle-net in Fig. 10.11.
 (10.42)
(Note that complex z=x+iy is cleared from the denominator by using z*=x-iy to give real r2= z*z=x2+y2.)
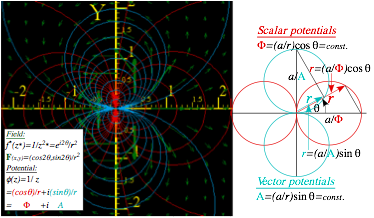
Fig. 10.11 Dipole F-field f(z)=1/z2and scalar potential (F=const.)-circles orthogonal to (A=const.)-circles.
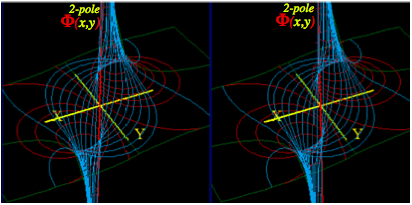
Fig. 10.12 Stereo 3D plot of dipole f(z)=1/zscalar potential F(x,y)with A-streamlines between poles.
A z-derivative turns 1-pole fields into 2-pole fields in (10. 41). It makes a copy of 1-pole in (10. 40) with a sign change and puts the (-)copy very near the original. What if we put a (-)copy of a 2-pole near its original? Well, the result is 4-pole or quadrupole field f4-pole and potential f4-pole, each a z-derivative of f2-pole and f2-pole.
![]() (10.43a)
(10.43a) ![]() (10.43b)
(10.43b)
Fig. 10.13 shows 4-pole structure. Two +∞-poles loom above Y-axis and two -∞-poles lurk below X-axis . The F-field vectors and their A-streamlines are shown running at 90° to F-equipotential lines in Fig. 10.13.
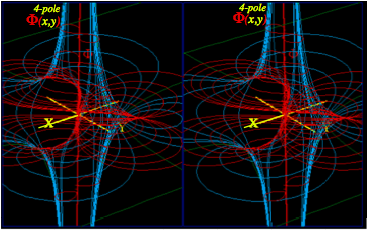
Fig. 10.13 Stereo 3D plot of quadrupole f(z)=1/z2scalar potential F(x,y)with A-streamlines between poles.
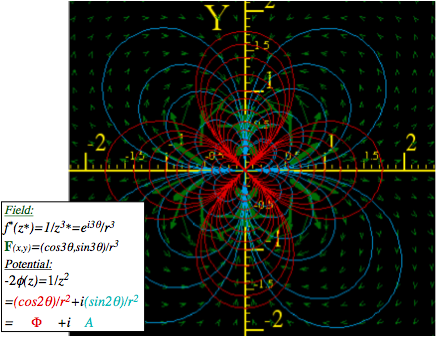
Fig. 10.14 F-field f(z)=1/z3 of 4-pole with scalar (F=const.)-equipotentials normal to (A=const.)-streamlines.
A field f(z) with sources only at origin (z=0) or at infinity (z=∞) may be given by power series that generalize Maclaurin series derived in (10.11) by using both positive and negative powers z±n. Series Sa±nz±n is called a Laurent series or multipole expansion (10.44) of a given complex field function f(z) around z=0. All field terms am-1zm-1 except 1-pole ![]() have potential term am-1zm/m of a 2m-pole at z=0 (z=∞) for m<0 (m>0).
have potential term am-1zm/m of a 2m-pole at z=0 (z=∞) for m<0 (m>0).
 (10.44)
The unique 1-pole(20-pole)fterm ![]() is not a constant a-1z0=a-1. (Constantfhas no field:
is not a constant a-1z0=a-1. (Constantfhas no field:![]() ) Also a 1-poleat z=∞ gives zero field near z=0. However, a 21-pole at z=∞ gives a constant field f(z)=a0 near z=0. A quadrupole (22-pole) at z=∞gives the linear field f(z)=a1zshown if Fig. 10.7, but a 22-poleat z=0 gives the field a-3z-3 in Fig. 10.14. Octupoles (23-poles) at z=∞ (or z=0) give a2z2 (or a-4z-4), and so on for m=4,5,…
) Also a 1-poleat z=∞ gives zero field near z=0. However, a 21-pole at z=∞ gives a constant field f(z)=a0 near z=0. A quadrupole (22-pole) at z=∞gives the linear field f(z)=a1zshown if Fig. 10.7, but a 22-poleat z=0 gives the field a-3z-3 in Fig. 10.14. Octupoles (23-poles) at z=∞ (or z=0) give a2z2 (or a-4z-4), and so on for m=4,5,…
The potential fexpansion is most useful for revealing multi-pole structure. A negative power fterm a-m-1z-m/m belongs to a 2m-pole at z=0. A positive power fterm am-1zm/m belong to a 2m-pole at z=∞. Pole field geometry involves mapping z-points onto a sphere so z=0 is its North Pole and z=∞ is its South Pole in Fig. 10.15. There a stereographic projection maps a point z=x+iyon the z-planetangent to North Pole into a point w=1/z=u+ivin the inverse w-plane tangent to the South Pole. The map geometry uses an inscribed rectangle. A pair of red unit circles |z|=1 and |w|=1 map into each other. Any point z inside the |z|=1 circle maps into a point w outside the |w|=1 circle as shown and vice-versa outside z maps to inside w.
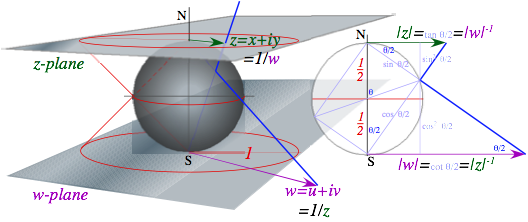
Fig. 10.15 Stereographic projection of z-plane through a unit-diameter sphere to inverse 1/z=w-plane.
Replacing zwith w=z-1 in (10.13) switches positive multi-pole-m terms in potential φ with negative ones.
![]() (from (10.44))
(from (10.44))
![]() (with z=w-1)
(with z=w-1)
![]() (with w=z-1)
(with w=z-1)
But, the unique monopole source term stays put with only a sign change (![]() ) as seen in Fig. 10.16a. Constant field f=a0 in (10.44) appears if there is a dipole at the South Pole and, vice-versa, a dipole field at the North Pole appears to be a constant field near the South Pole as seen in Fig. 10.16b.
) as seen in Fig. 10.16a. Constant field f=a0 in (10.44) appears if there is a dipole at the South Pole and, vice-versa, a dipole field at the North Pole appears to be a constant field near the South Pole as seen in Fig. 10.16b.
Of all 2m-pole field terms am-1zm-1, only the m=0 monopole a-1z-1 has a non-zero loop integral (10.39).
![]()
![]()
This m=1-poleconstant-a-1formula is just the first in a series of Laurent coefficient expressions.
![]()
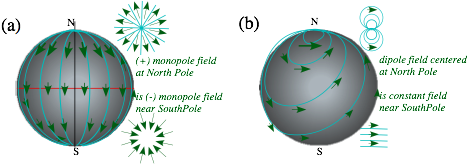
Fig. 10.16 Projective sphere view of North Pole (z=0) sources. (a) monopole (b) dipole.
Source analysis starts with 1-pole loop integrals ![]() or, with origin shifted
or, with origin shifted ![]() . They hold for any loop around point-a. A continuous function f(z) is just f(a) on a tinycircle around point-a.
. They hold for any loop around point-a. A continuous function f(z) is just f(a) on a tinycircle around point-a.
![]() (10.45a)
(10.45a) ![]() (10.45b)
(10.45b)
The f(a)result is called a Cauchy integral. Then repeated a-derivatives gives a sequence of them.
![]()
This leads to a general Taylor-Laurent power series expansion of function f(z) around point-a.
![]() (10.45c)
(10.45c)
If the function f(z)has no poles inside the contour then only positive powers n>0 are needed in its expansion and the series above reduces to a Taylor series or (if a=0) a Maclaurin series like (10.12) derived previously. There the nth expansion coefficient an is given by nth derivative of f(z) as in (10.45c) above. Otherwise, negative powers are needed with coefficients given by nth order pole loop integrals above.
This represents just a “tip of an iceberg” for an enormous subject of complex analysis. We shall use only tiny portions of this grand mathematical subject, and later we will consider generalizations of complex numbers to hyper-complex quaternions and spinor operators in Unit 4. This takes the analysis from a 2D framework into a 3D and 4D description that is more like the space-time we seem to live in.
Exercises
Construct dipole function geometry of Fig. 10.11.
We last left the neutron starlet orbiting on an ellipse inside the Earth in Fig. 9.10 according to
x = a cos w t (9.13a)repeated y = b sin w t (9.13b) repeated
Here we show a Kepler construction for such an orbit that works for any ellipse. (Recall also Fig. 3.5.) It also teaches us some nice physics and geometry that we will use on the velocity-velocity KE-ellipses to begin the study of Lagrangian, Hamiltonian and action functions while introducing contact transformations in the following Sec. 12. Much of this will be brought together in the physics of trebuchets in Unit 2.
To be historically correct, Kepler was concerned with elliptic orbits that lie outside of the Earth not the inside-Earth orbits in a linear force law F(r) = -kr that we plotted. As we will show in Unit. 5, outside orbits in a Coulomb force law F(r) = -kr-2 also have elliptic orbits, albeit with origin r=0 at a focal point. That’s a little more complicated. So, we first study the easier inside-Earth orbit ellipses that have r=0 centered. This gives some properties of their country cousins who live well outside the city limits.
Fig. 11.1 shows an easy 4-step construction for points on a (major-radius=a, minor radius=b)-ellipse. Note that you don’t have to draw OA first. You may pick a vertical (AX) or a horizontal (BR) line first and then find the others including the OA radius that goes with your choice. Given x or y, you find t.
The big a-circle acts like a clock dial. The x-shadow or projection of the clock dial is x = a cosw t and every mass that starts at x=a at zero-x-velocity will forever live in the shadow of the tip of the clock hand. This includes any ellipse with semi-major axis a, but arbitrary semi-minor axis b.
The ellipse in Fig. 11.1 has b=1 and a= 2.2. The speed of the orbiting mass can be estimated by the space between positions at equal time intervals. Speed is smaller as the mass rounds the long end of the ellipse than it is as it zips by the minor axis. In fact we shall show that it is exactly 2.2 times faster, a result that is attributed to Johannes Kepler and is the result of the conservation of angular momentum.
As mentioned before after Fig. 9.8, all orbits have the same period, and the mass that tunnels through the Earth center at the bottom of Fig. 11.1 has exactly the same x-equation x = a cos w t as the ellipse-following mass above it. They differ only in their y-equation y = b sin w t ; in the first case the tunneling mass has b=0. A circular orbit would have b=a, but its x-equation would be the same. Note how the radius vector r of the mass lags behind the ω t-clock-hand at first, but then at the b-axis low point (perigee) of the orbit it catches up and passes until the clock hand catches it again at the other a-axis high point (apogee or “up-ogee”). This leap-frog motion relates to one of Kepler’s most famous laws and the conservation of angular momentum as will be reviewed shortly.
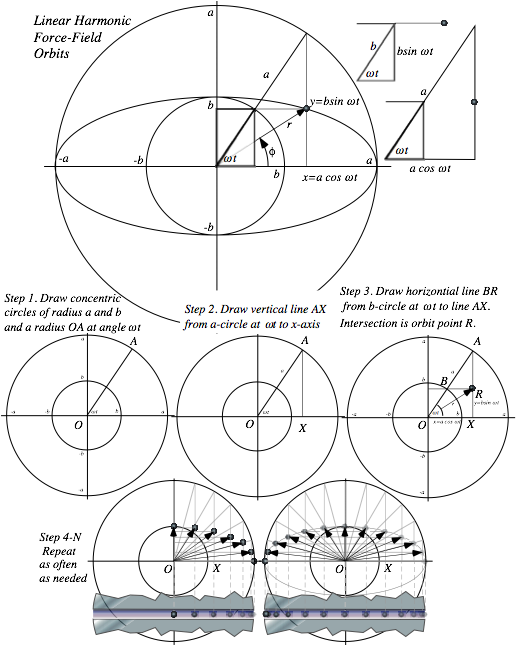
Fig. 11.1. Harmonic force-field elliptical orbit construction.
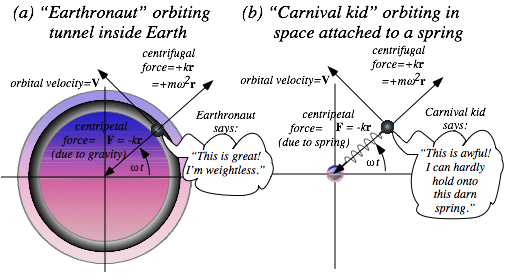
Fig. 11.2 Two different systems with identical oscillator orbits. (a) Inside Earth, (b) Mass on spring.
Imagine an “Earthronaut” orbits inside the Earth in a linear gravity field F=-kr, as sketched in Fig. 11.2(a). (Recall “starlet” in Fig. 9.9.) Let’s compare to a kid rotating in a carnival ride at one end of a spring as the other end pivots frictionlessly about a fixed point. (See Fig. 11.2(b).) Each m does the same orbit, but there’s a big difference. You’d notice it if you were the mass m.
The Earthronaut feels weightless like astronauts in orbit. But the rotating kid feels a great outward pull, a centrifugal or center-fleeing force F=+kr. Stop the rotating “carnival kid” and the centrifugal force goes away. If the kid lets go he feels weightless in space. Stop the orbiting Earthronaut and the inward tug F=-kr by the centripetal or center-pulling force of gravity returns as the Earthronaut resumes weighing mg=kr. Earth gravity is no longer cancelled by inertial reaction force and he cannot let go of g.
An orbiting Earthronaut feels weightless because the two forces, outward centrifugal F=+kr and inward centripetal F=-kr , cancel to zero for body mass m or any part of it. On the other hand, the carnival kid feels stretched out by two equal and opposite forces, again an outward centrifugal F=+kr pulling the kid up opposes an inward centripetal F=-kr provided by the spring that the kid is holding onto.
In each case, outward centrifugal F=kr is due to rotation at angular rate w around a circle of radius r at velocity V= w r. The angular rate w is the Earth or spring oscillator frequency from (9.9) or (10.23).
![]() (11.2a) or:
(11.2a) or: ![]() (11.2b)
(11.2b)
Centrifugal force formulas that result are among the most famous formulas in rotational mechanics.
Fcentrifugal = k r = mω2 r = m V2/r where: V= w r (11.3a)
Removing the mass m gives the also-famous centrifugal acceleration formulas.
acentrifugal = ω2 r = V2/r where: V= w r (11.3b)
A geometer likes to imagine fitting a curve by circles at each point with smaller circles fitting more curvy points. These so-called circles of curvature become bigger circles as a curve straightens out. A geometer-physicist does the same, but imagines driving at a constant speed V along the curve with an accelerometer to measure transverse centrifugal acceleration acentrifugal. By (11.3b) the accelerometer reads V2/rcurv outward from a curve if the car is rounding a circle of radius rcurv = V2/ acentrifugal with its center that distance inside the curve. The acentrifugal-reading is inversely proportional to radius of curvature for fixed linear velocity V, but directly proportional to it for fixed angular velocity ω.
rcurv = V2/acentrifugal= acentrifugal /ω2 where: V= w rcurv (11.3c)
It is a strange but useful view of a curve! The physicist imagines riding a carnival Merry-Go-Round whose rim speed V is constant but whose radius and center keep changing! If the road straightens to veer the other way, the Merry-Go-Round center becomes infinite and reappears on the other side.
Note that road speed V is constant in the physicist’s image. There’s no acceleration along the road, only perpendicular to it. However, in real orbits around planets or springs, velocity V holds constant only for circular orbits or, ever so briefly, at special points on elliptical ones. One special point is a low point or perigee. Another is a high point or apogee. (Think “ap” means “up” in space lingo.)
An astronaut in an elliptic orbit or a mass on an elliptic oscillator orbit like Fig. 11.1 will increase speed (accelerate) as it “falls” from the high-point apogee on the x-axis toward the low-point perigee on the y-axis. Then it will decrease speed (decelerate) as it rises back to apogee. Only at apogee or perigee is the speed momentarily constant. Then, and only then, is force and acceleration perpendicular to the flight path. In between, the F=-kr vector makes an angle q with velocity V that is not 90° so the work (dW= F•dr= |Fdr| cosq) or power (P= F•V= |FV| cosq) is non-zero so kinetic energy varies.

Fig. 11.3 Elliptic orbit force, velocity, and power variation.
Carnival kid would feel even more forces on an elliptic orbit, though the Earthronaut may still be nearly weightless. Gravitational force is balanced by centrifugal force and, between apogee and perigee, by another kind of inertial force called the Coriolis force that opposes orbital velocity.
To visualize Coriolis force imagine what you would feel walking along a radial railing toward the center of a Merry-Go-Round rotating to your right as in Fig. 11.4(a). The railing pushes you left (against the rotation) to slow you down to zero speed when or if you get to the center of the Merry-Go-Round. The Coriolis force is proportional to your radial walking speed. Stop walking inward and all you feel is the usual centrifugal force pulling back out along the radial railing path. Walk back out and Coriolis pushes you to the right to get you up to the Merry-Go-Round rotation speed at each point.
Coriolis forces can make you dizzy and nauseous. Centrifugal force is steady as long as you are fixed to the Merry-Go-Round. But, if you just turn your head, the fluids in your inner ear get a kick perpendicular to the direction of motion and they’re not used to that. Barf!
Fig. 11.4(b) shows centrifugal and Coriolis forces of an inward falling orbiting mass analogous to that of the Merry-Go-Round. The Coriolis force acts oppositely to orbital velocity V on the way in and then acts with V on the way out in Fig. 11.4(c). At apogee or perigee in Fig. 11.4(d) there is centrifugal-centripetal force but no Coriolis force since the mass momentarily stops its radial motion.
The Earthronaut may not feel centrifugal or Coriolis forces if every atom almost perfectly balances inertial force by equal and opposite gravitational force to make a feel-force-free orbit. But, “almost” is not zero! Suppose our astronaut is on a 1 kHz neutron star orbit. (That’s w=2000π.) He (or she) is toast and jelly due to what is called tidal force. Only the astronaut’s center-of-gravity is right on a feel-force-free elliptic orbit. For the rest that’s the wrong ellipse! The poor astronaut’s left and right hands (and ears and other bilateral pieces of anatomy) try to change places 2000 times per second as disparate free-fall orbits crisscross back-and-forth twice each period. Really barf!
The k-constant or spring constant for an oscillator tidal force felt by a neutron-astronaut (who will be reduced to a “neuternaut” by one orbit) is given by (11.2b).
k=mw 2= m6.282 E6 (N/m) for: w=2000π
That is almost 40 million Newtons (10 million lbs. or 5 thousand tons) for each kilogram of mass a meter off-center or 50 tons of pressure just on a 1 cm-sized fingertip.
Quite a number of astrophysical effects are due to tidal forces like ocean tides. The Moon presents one face because its tides due to Earth have wasted as much of its rotational energy as possible. So it’s locked relative to Earth with only slight (but quite interesting) nutational wobbling due partly to its eccentric orbit.
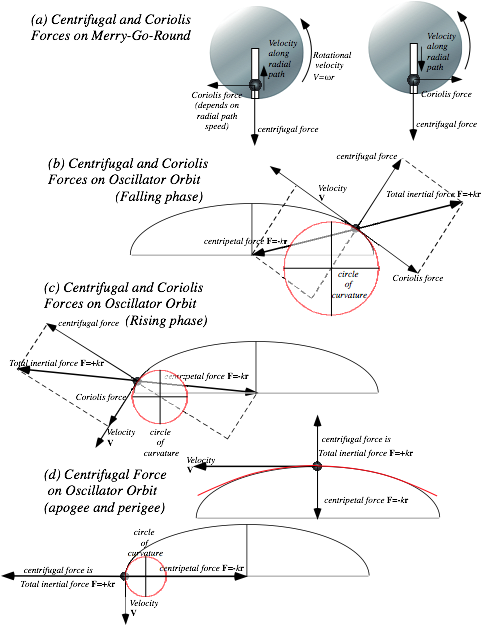
Fig. 11.4 Centrifugal and Coriolis forces. (a) Simple Merry-Go-Round. (b-d) Various orbital phases.
An ellipse orbit is characterized using vectors r, v, and F= ma that are arrows in Fig. 11.4. First, there is the location, position, or radius vector r that we found in (9.13).
![]() (11.5a)
(11.5a)
Second, there is the rate, speed, or velocity vector v that is a 1st time derivative![]() .
.
![]() (11.5b)
(11.5b)
Unit-m force F is proportional to 2nd derivative (Change-of-velocity is acceleration a) and is just -w2r.
![]() (11.5b)
(11.5b)
Then the 3rd derivative (Change-of-acceleration is jerk j), is just -ω2v,
![]() (11.5c)
(11.5c)
and finally the 4th derivative (Change-of-jerk is inaugurationi), equals the r-vector with a scale factor w4.
![]() (11.5d)
(11.5d)
Linear Hooke force F=-kr gives F=ma=-kr then a=-ω2r then j= -ω2v, and so on. The 5th derivative (Change-of-inauguration is revolution) is just ω5v. As plotted in Fig. 11.5, the four vectors r, v/w, a/ω2, and j/ω3 follow each other on one ellipse orbit of Fig. 11.1 taking turns to slow down then to speed up.
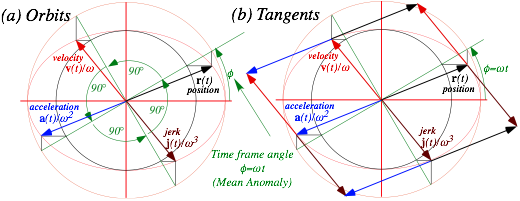
Fig. 11.5 Harmonic oscillator orbit ellipse (a) All derivatives follow same orbit. (b) Related tangents.
Each of the four vectors r, v/ω, a/ω2, and j/ω3 in Fig. 11.5 has a time-phase angle or mean anomaly value f=wt that is spaced at π/2 intervals ωt, ωt+p/2, ωt+p, and ωt+3p/2, respectively, as listed below.
 (11.6a)
  (11.6b)
  (11.6c)
  (11.6d)
Ellipse equation ![]() may be written using a matrix
may be written using a matrix ![]() on position vector
on position vector ![]() .
.
 (11.7)
Function r•Q•r is a quadratic form QF. QF’s are useful to mechanics and their powerful geometry will be demonstrated for orbit ellipses and later for KE ellipses. First note that if a matrix ![]() acts on a radial position vector
acts on a radial position vector ![]() it gives a vector p perpendicular to ellipse tangent
it gives a vector p perpendicular to ellipse tangent ![]()
![]() at r.
at r.
![]() (11.8a)
(11.8a)
p is perpendicular, that is, orthogonal to the velocity vector v=![]() (11.5b) as seen here and in Fig. 11.6.
(11.5b) as seen here and in Fig. 11.6.
![]() (11.8b)
(11.8b)
These p-vectors define their own ellipse r•Q-1•r=1 of an inverse quadratic formQ-1F. Its radii are inverse (1/a,1/b) of the original Q-ellipse radii(a,b) in (11.7). The Q-1F-ellipse is the dashed oval in Fig. 11.6.
![]() (11.9)
(11.9)
Inverse operation Q-1•p on perpendicular p returns the radial position vector r on the Q-ellipse.
![]() (11.10a)
(11.10a)
r is orthogonal to the Q-1F-ellipse tangent![]() , just as p is orthogonal to the QF-ellipse tangent
, just as p is orthogonal to the QF-ellipse tangent![]() in (11.8b).
in (11.8b).
![]() (11.10b)
(11.10b)
Vectors p and r maintain a unit mutual projection, that is, dot-products p•r and![]() always equal 1.
always equal 1.
![]() (11.10c)
(11.10c)
Fig. 11.6b shows a geometric-algebraic symmetry whereellipse plots are scaled by geometric mean S=√(ab) so that each scaled major radius aS=a/S is the inverse of its minor radius bS=b/S and aS bS=1.
aS=a/S=√(a/b)=1/bS (11.11a) bS=b/S=√(b/a) =1/aS (11.11b)
Then inverse ellipse r•Q-1•r=1 is an axis switch (![]() ) or 90° rotation of ellipse r•Q•r=1 by symmetry.
) or 90° rotation of ellipse r•Q•r=1 by symmetry.
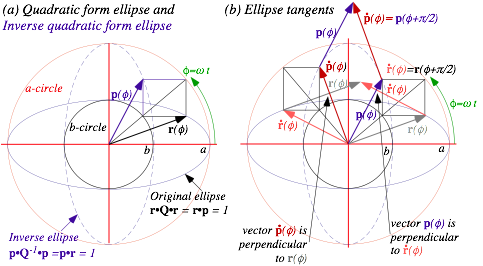
Fig. 11.6 Ellipse vectors and tangents for quadratic forms. (a) Ellipse vectors. (b) Tangent geometry.
Matrix![]() or
or ![]() acting on a vector
acting on a vector ![]() multiplies its slope
multiplies its slope![]() by a/b or b/a respectively.
by a/b or b/a respectively.
![]() (11.12a)
(11.12a) ![]() (11.12b)
(11.12b)
Matrix![]() or
or ![]() multiplies slope by a2/b2 as in (11.8a) or b2/a2 as in (11.10a).
multiplies slope by a2/b2 as in (11.8a) or b2/a2 as in (11.10a).
![]() (11.13a)
(11.13a) ![]()
![]() (11.13b)
(11.13b)
Only vectors of slope zero or infinity, such as ![]() or
or ![]() , are immune to slope-change by R or R-1.
, are immune to slope-change by R or R-1.
![]() (11.14a)
(11.14a) ![]() (11.14b)
(11.14b)
They are called eigenvectors of R-1 or any power ![]() of R or R-1.
of R or R-1.
![]() (11.15a)
(11.15a) ![]() (11.15b)
(11.15b)
![]() (11.15c)
(11.15c) ![]() (11.15d)
(11.15d)
These special vectors are operator Rp’s own base vectors for any power p. Eigenvector is German for “own-vector.” Base vectors ![]() and
and![]() define a Qp-and-Rp-ellipse’s own major and minor axial directions. The axial radii a and b are the eigenvalues of R-1 in (11.14). Powers apand bp are eigenvalues of R-p.
define a Qp-and-Rp-ellipse’s own major and minor axial directions. The axial radii a and b are the eigenvalues of R-1 in (11.14). Powers apand bp are eigenvalues of R-p.
Each action of R (or Q) on vector r grows its slope by a/b (or a2/b2) so it approaches eigenvector![]() while R-1 and Q-1 make it approach eigenvector
while R-1 and Q-1 make it approach eigenvector ![]() . Each slope polar angle fk plotted in Fig. 11.7 is obtained from its neighbors fk-1 and fk+1 by inscribing a rectangle between r=a and r=b with its main diagonal on the fk line. Lower and upper corners on the cross-diagonal give radial position r(fk-1) on the Q-ellipse and perpendicular p(fk+1) on the Q-1-ellipse, respectively, following Fig. 11.1 and (11.13).
. Each slope polar angle fk plotted in Fig. 11.7 is obtained from its neighbors fk-1 and fk+1 by inscribing a rectangle between r=a and r=b with its main diagonal on the fk line. Lower and upper corners on the cross-diagonal give radial position r(fk-1) on the Q-ellipse and perpendicular p(fk+1) on the Q-1-ellipse, respectively, following Fig. 11.1 and (11.13).
p(fk+1)=Q•r(fk-1) where: tan(fk+1)= (a/b) 2 tan(fk-1) (11.16)
For the kth triad, angle fk =wtk is the “timer” angle and polar angle of main diagonal while fk-1 is the polar angle of radial position r(fk-1) and fk+1 is the polar angle of perpendicular p(fk+1) to velocity ![]() (fk-1)= v(tk).
(fk-1)= v(tk).
p(fk+1)•![]() (fk-1)=0=
(fk-1)=0=![]() (fk+1)•
(fk+1)•![]() (fk-1) (11.17a) p(fk+1)•r(fk-1)=1 (11.17b)
(fk-1) (11.17a) p(fk+1)•r(fk-1)=1 (11.17b)
This restates the duality relations (11.10) for an entire sequence, part of which is shown by Fig. 11.7b.
A {fk} sequence may start on any angle but a choice f0=p/4 in Fig. 11.7 gives symmetric results. Also, we may let: ab=1 and: ![]() below by assuming unit scale S=1 in (11.11).
below by assuming unit scale S=1 in (11.11).
![]()
![]()
![]()
![]() (11.18a)
(11.18a) ![]() (11.18b)
(11.18b) ![]() (11.18c)
(11.18c)
![]()
![]()
![]()
Triads {rk+1,rk,rk-1} and {pk+1,pk,pk-1} of vectors rk=r(fk) and pk=p(fk) are given for f0=p/4.
![]()
![]()
![]() (11.19)
(11.19)
Each triad {rk+1,rk,rk-1} easily gives the tangent vk-1=v(fk-1)=![]() that contacts the Q-ellipse at rk-1. An arc by rk intersects rk+1 where vk-1 is perpendicular to rk+1 or pk+1=p(fk+1). (See Fig. 11.7a and exercises.)
that contacts the Q-ellipse at rk-1. An arc by rk intersects rk+1 where vk-1 is perpendicular to rk+1 or pk+1=p(fk+1). (See Fig. 11.7a and exercises.)
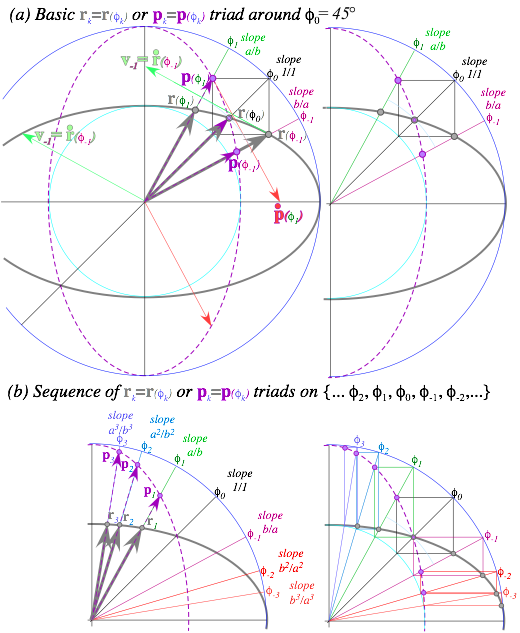
Fig. 11.7 Triad sequence geometry of radial position vector r(φn-1) and tangent-perpendicular p(φn+1).
So far we have drawn ellipses whose axes are unrotated and line up with the Cartesian coordinate axes of a standard page. Ellipses in other coordinate bases may appear rotated, and certainly an orbit of an isotropic oscillator may choose any direction for its axes.
However, all the relative geometric properties such as their tangent geometry are the same in all bases. The following general 2D quadratic form gives a rotated conic section (ellipse or hyperbola).
![]() (11.20)
(11.20)
It’s abstract vector equation 1=r•Q•r looks the same in any coordinate base system, but the matrix components may include non-zero off-diagonal elements B≠0 that indicate it is a rotated ellipse.
The shape and rotational orientation of an isotropic oscillator orbit ellipse is constant with time. The cross product of rxv of position and velocity is also a constant of the motion by (11.5). (See App. 1.A.)
![]() (11.21)
(11.21)
The quantity L=mrxv is called orbital angular momentum. It’s conserved as mass m orbits.
![]() (11.22)
(11.22)
It means the area of r+v or r-v triangles, as discussed in Appendix 1.A, are constant on an orbit as indicated in Fig. 11.8 below. Area enclosed by r and v is proportional to the area π ab of the whole orbit.
![]()
Fig. 11.8 Vector r+v and r-vparallelogram and triangle areas are constant all during orbit.
By (11.22), velocity at perigee (x=0,y=b) is vb=L/mb=aw. At apogee it slows to va=L/ma=bw. This is consistent with velocity formula (11.5b). Constant momentum relates to Kepler’s Law: the radius r-vector sweeps the same area every second or every hour and equal time means equal area.
This is true since the triangle made of r and dr=v dt has the same area 1/2rxv dt = (L/m)dt for the same time interval dt. This law applies to any central force that is a function of radius r alone, not just the oscillator force F=-k·r. This includes the Coulomb force F=-k/r2, which is the only other force to have elliptical orbits that maintain their orientation.
The oscillator and Coulomb forces each have hidden symmetry beyond their Keplerian rotational isotropy that conserves angular momentum and this makes their orbits have simple geometric properties. This extra symmetry will be analyzed in units 4 and 5.
If linear momentum and angular momentum are conserved they often do so together. As an example, we consider the flight of a rigid rod or stick in free space. Flying rods are treated in Sec. 6.4 of the rigid body unit (Unit 6) but elementary aspects of rigid body motion are easy to derive and they display cycloid geometry that is useful for several classical mechanical phenomena. A mass m rotating on a circle of radius r with angular velocity ω has a linear tangential velocity V=w·r and kinetic energy ![]() . (Recall (9.10) for orbiting starlet.) An angular form is derived here again.
. (Recall (9.10) for orbiting starlet.) An angular form is derived here again.
![]() (11.23)
(11.23)
Circular orbiter angular momentum (from (11.22) above) takes an angular form, too.
![]() (11.24)
(11.24)
In each the point mass rotational inertia ![]() replaces linear mass m while angular velocity w replaces V.
replaces linear mass m while angular velocity w replaces V.
A rod or lever of length l rotating about one end is viewed as an integral from r=0 to r=l of its mass points ![]() each of infinitesimal inertia
each of infinitesimal inertia ![]() . Density r is the rod’s total mass M per length l, and that is assumed to be uniform. Total inertia follows from taking the integral over its length.
. Density r is the rod’s total mass M per length l, and that is assumed to be uniform. Total inertia follows from taking the integral over its length.
![]() (11.25)
(11.25)
This inertial formula is true for two identical rods of length l welded end-to-end and rotating about that point. Now mass M is that of the total system. In free space the straight welded rod will rotate naturally with constant angular velocity w about the welded point at its center of mass and that center travels at a constant velocity ![]() until hit by an outside force.
until hit by an outside force.
Then free-space paths of each point on the rod, including its center-of-mass, are generalized cycloids such as are shown in Fig. 11.9. There are two dots on the rod (a red dot • and a green dot •) that follow normal cycloids. Each comes to a complete stop at a cycloid cusp (as green dot • is in the lower center of the figure) while the opposite dot is just reaching its maximum velocity (as red dot • is in the upper center of the figure). On left and (later) right sides of Fig. 11.9 is similar with rod flipped.
Imagine dot • and dot • are pieces of gum stuck to opposite sides of a tire (green circle of radius p in Fig. 11.9) rolling left-to-right along a line (“road”) with rod CM point attached at tire center. A blue dot • on one end of the rod is initially above the green dot • (upper left of Fig. 11.9) while the rod’s lower end has a violet dot • attached below the red dot • where the tire initially meets the road. Rod points outside tire radius (blue dot • and violet dot •) trace curlate cycloids. Inside points (CM and yellow dot •) trace prolate cycloids. The CM just follows a straight line at constant speed. Tire radius p depends on hit-height h above CM point where momentum impulse P is delivered in Fig. 11.10. However, regardless of h, the CM point will travel at constant linear velocity V=P/M while the rod conserves linear momentum P=MV.
Angular velocity w relates to hit-height h factor in angular momentum Iw=L=Ph and to tire radius p where red dot • on tire comes to rest on road, and velocity wp=Php/I due to rotation cancels velocity V=P/M due to translation. This gives relation hp=I/M. Rod inertia ![]() then gives relation
then gives relation ![]() between hit-height h and radius p of percussion for rod of radius l. We call point h a “sweet-spot” for point p.
between hit-height h and radius p of percussion for rod of radius l. We call point h a “sweet-spot” for point p.
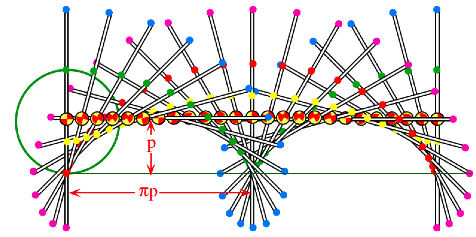
Fig. 11.9 Free flying rod of length L=2l rolls left-to-right on “tire” of radius p. 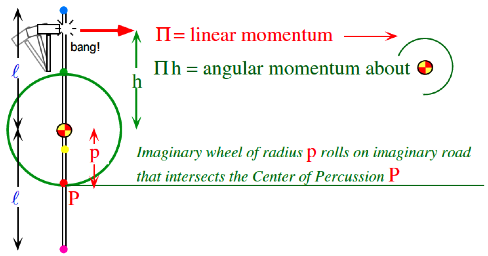
Fig. 11.10 Impulse hit-height h relates to rod radius land percussion radius p of rolling “tire.”
If the hit-height h is zero then percussion radius p is infinite and all points of the rod follow straight parallel paths since there will then be zero rod rotational velocity w and zero angular momentum L=Ph. Only linear velocity V=P/M would be nonzero then. If the hit-height h is equal to l (the maximum practical value of h is the radius l of rod) then the percussion radius is p=l/3, its minimum practical value.
Reducing h increases p proportionally. The two are equal at the value p=l/√3=h=0.866l which is called the radius of gyration of the rod. Reducing hit-height h further to l/2 and l/3 increases the percussion radius p to p=2l/3 and p=l, respectively. The percussion point is where you can hold the lever and feel the very least recoil during the hit. In fact, the dynamics at a normal cycloid cusp point at radius p in Fig. 11.9 amounts to a gentle tug along the lever but no force perpendicular to it.
Baseball bats are made thicker at the hitting end to accommodate h and p points further from the ends than allowed by p=h=0.866l. Cricket bats, on the other hand, seem to be more like sticks.
The ellipse in Fig. 5.1 is skinny and difficult to see. To better view multiple collisions, the v1-v2 axes are rescaled into “quasi-velocities” Vk=vk √mk so the ellipse fattens into a nice circle in Fig. 5.2.
![]() where:
where: ![]() and:
and: ![]() (12.1)
(12.1)
The half-power mass scale is helpful. A full power mk-scale converts velocity vk to momentum pk.
![]() where:
where: ![]() and:
and: ![]() (12.2)
(12.2)
Geometry of a p-ellipse is just a flip of the v-ellipse, but there are compelling algebraic reasons for dealing with such alternative functions. In fact two of these functions have famous names attached.
An energy that is an explicit function of velocities is called a Lagrangian function L=L(vk..).
![]() (12.3)
(12.3)
An energy that is an explicit function of momenta is called a Hamiltonian function H=H(pk..).
![]() (12.4)
(12.4)
A compromising function like (12.1) has no famous name so we’ll call it an Estrangian E=E(Vk..).
![]() (12.5)
(12.5)
While all these functions may have the same numerical value for a given situation, the have quite different functional dependence. To emphasize this let us write our first equations of (non)-motion.
![]() (12.6a)
(12.6a) ![]() (12.6b)
(12.6b) ![]() (12.6a)
(12.6a)
The first two for L and H say that L has no explicit p-dependence and H has no explicit v-dependence. L may still vary if p varies but L is not defined by p and the same for H and v. Calculus distinguishes total derivatives ![]() or
or ![]() from partial derivatives
from partial derivatives ![]() or
or![]() and begins by defining differential chain rules.
and begins by defining differential chain rules.
![]() (12.7a)
(12.7a) ![]() (12.7a)
(12.7a)
Then L (or H) varies with vk, pk, or any variable z according to derivative chain rules.
![]() (12.7a)
(12.7a) ![]() (12.7a)
(12.7a)
Each chain sums only over variables its function knows and has explicit dependence. Imagine L is married to v (and some others indicated by dots) and H is married to p. Each function cannot use the other’s dependents without serious discussion and renaming. Otherwise it (and you) get in big trouble!
A Lagrangian ellipse plot L(v)=const. in Fig. 12.1a is similar to the superball collision diagram in Fig. 5.1. It is to be compared with the corresponding Estrangian ellipse plot E(V)=const. in Fig. 12.1b and the Hamiltonian ellipse plot H(p)=const. in Fig. 12.1c. COM and collision line slopes are compared.
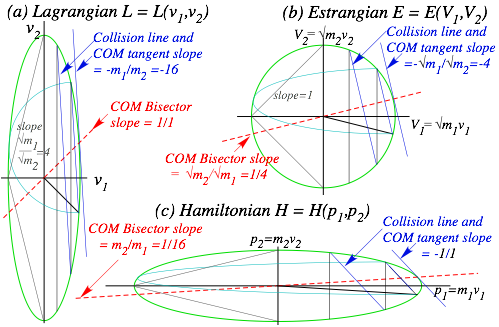
Fig. 12.1 KE ellipse functions related by scale. (a) L in velocity vk space. (b) E in Vk. (c) H in pk.
Functions L, E, and H are quadratic forms of vectors v, V=R•v, and p=M•v=R2•v, respectively.
![]() (12.8a)
(12.8a) ![]() (12.8b)
(12.8b) ![]() (12.8c)
(12.8c)
The corresponding scaling matrices are powers of the root-mass matrix: R=![]()
![]()
![]()
![]() (12.9)
(12.9)
The 2nd power rescaling M=R2 mass matrix maps L(v) space (a) into Hamiltonian H(p) space (c).
This p-to-v tangent-normal mapping is analogous to the r-to-p mapping in Fig. 11.7 and is displayed in a Fig. 12.2 below, an overlap of parts (a) and (c) of Fig. 12.1. A normal v to the H-ellipse is given by a p-space gradient operation ![]() on H and vice-versa for the normal p to the L-ellipse.
on H and vice-versa for the normal p to the L-ellipse.
![]() (12.10a)
(12.10a) ![]() (12.10b)
(12.10b)
Component notation helps to clarify the vector symbols.


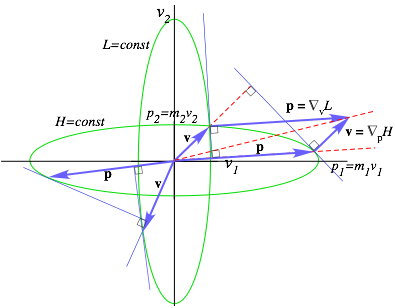
Fig. 12.2 Tangent-normal mapping between Lagrangian L(v) space and H(p) space.
It might appear that quadratic forms![]() and
and ![]() both may be written simply as
both may be written simply as ![]() or
or ![]() given mapping
given mapping ![]() or inverse
or inverse ![]() . This is correct numerically but functionally wrong. Instead what we want is
. This is correct numerically but functionally wrong. Instead what we want is ![]() or else
or else ![]() , which give correct derivatives.
, which give correct derivatives.
The result is called the Legendre contact transformation between H(p) and L(v).
![]() (12.11a)
(12.11a) ![]() (12.11b)
(12.11b)
There is not a lot of difference between these two equations! Most importantly they give the correct partial derivatives so we get zero for ![]() or
or![]() according to the definitions in (12.6), as follows.
according to the definitions in (12.6), as follows.
 (12.12a)
  (12.12b)
The results are the first Hamilton equation and the first Lagrange definition (Recall (12.10). Reversing p and v derivatives gives them again in reverse order. This formalism really wants you to know them!
 (12.12c)
  (12.12d)
Along an H-tangent line at its ellipse contact point, H is fixed while L may vary and vice-versa.
The Legendre relation (12.11a) becomes Poincare’s invariant differential if ![]() has dt cleared.
has dt cleared.
![]() (12.13a)
(12.13a)
It is also called the differential dS of action S, the quantity that determines quantum phase.
![]() (12.13b)
(12.13b)
The time dependent or reduced action is just the integral ![]() . The least action principles are the subject of the advanced Units 7 and 8.
. The least action principles are the subject of the advanced Units 7 and 8.
The remaining equations of motion involve spatial gradients or derivatives ![]() and
and ![]() which only contribute if a potential U(r) or r-dependent M-coefficients are present. Both are needed in the following Units 2. Then a force
which only contribute if a potential U(r) or r-dependent M-coefficients are present. Both are needed in the following Units 2. Then a force ![]() can change momentum by Newton’s equation
can change momentum by Newton’s equation ![]() or (3.10c) or (6.0).
or (3.10c) or (6.0).
![]()
In Unit 2 we derive equations for a Hamiltonian ![]() and Lagrangian
and Lagrangian ![]() .
.
![]()
![]()
The second one is part (a) or (d) of (12.12). We will see that Poincare’s relation (12.13) is quite general.
Vectors have relative projections onto each other. Components x, y, or z are projections of r onto unit i, j, and k. Power F•v=Fvcosq is a dot product cosine projection of F on v. Coriolis a=![]() =wvsinq is a sine-like transverse projection called the cross product. Product A•B (or |AxB|) is cosine (or sine) of a relative angle (qB-qA) times length factor AB shown in Fig. 1.A.1. Also, recall complex products in (10.30).
=wvsinq is a sine-like transverse projection called the cross product. Product A•B (or |AxB|) is cosine (or sine) of a relative angle (qB-qA) times length factor AB shown in Fig. 1.A.1. Also, recall complex products in (10.30).
The cosine or dot-projection may be given in Cartesian lab components (Ax=AcosfA) Ay=AsinfA).
![]() (1.A.1a)
(1.A.1a)
The sine or cross-projection has a somewhat different or “crossed-up” form.
![]() (1.A.1b)
(1.A.1b)

Fig. 1.A.1 Vector component geometry (a) Lab-relative. (b) A-relative. (c) B-relative.
Here A•B and AxB are numbers or scalars. Full AxB definition ((1.A.4b) below) is a vector perpendicular to both A and B. (In Fig. 1.A.1, it would stick out of the page.) Also it happens that AxB is the area of the vector parallelogram and 1/2AxB is the area of the A+B or A-B triangle as shown in Fig. 1.A.2.
In Fig. 1.A.1b vector B refers to axes made of vector A and its perpendicular copy A¿ and vice-versa in Fig. 1.A.1(c). Dot products are reflexive (A•B =B•A). However, cross products must be anti-reflexive (AxB=-BxA) since the B¿ vector is in a negative direction relative to A in Fig. 1.A.1(c). One way to display the relation between the pair (A, A¿) and the pair (B, B¿ ) is in a rotation matrix.
![]() (1.A.2)
(1.A.2)
Algebraic definitions of A•Band AxB are based on the symmetricKronecker function δij and the totally anti-symmetric Levi-Civita function εijk defined as follows.
![]() (1.A.3a)
(1.A.3a)  (1.A.3a)
These are fundamental to tensor analysis and exterior calculus that will be introduced in Unit 3.
They also define scalar A•B and vector AxB products in useful ways for fast computer logic, as follows.
![]() (1.A.4a)
(1.A.4a) ![]() (1.A.4b)
(1.A.4b)
The notation Ck=(C)k denotes the kth component of a vector C.
Levi-Civita sums define the determinant detU of a matrix Uij. An expansion by minors is shown here.
 (1.A.5)
A triple vector product AxB•C is such a determinant made from a matrix of three vector components.
 (1.A.6a)
![]() (1.A.6b)
(1.A.6b)
Minor expansion (1.A.5) is a (•)-product of A with (![]() )-product vector BxC. Base area |BxC| times altitude (A projected onto normal BxC) equals the parallelepiped volume enclosed by A, B, and C.
)-product vector BxC. Base area |BxC| times altitude (A projected onto normal BxC) equals the parallelepiped volume enclosed by A, B, and C.
Anti-symmetric ε-forms let us generalize geometry from 2-and 3-dimensions to N-dimensions. Advanced mechanics has many dimensions. One mole (6·1023 particles) has at least 6·1023 dimensions and two or three times that if the atoms move in 2D or 3D. So e-forms are necessary!
Products of anti-symmetric ε-forms reduce to symmetric d-forms by a LeviCivita identity.
![]() (1.A.7)
(1.A.7)
A triple-cross-product formula ![]() is a first application.
is a first application.

The LC-identity (1.A.7) reduces each sum over k to dot-product terms.

Fig. 1.A.2 Cross-product and area of (a)-(b) Parallelogram, (c) Sum triangle, (d) Difference triangle.
The Levi-Civita e-identity is helpful for unraveling operator products. One example is the expressions for magnetic force ![]() where field B is a curl
where field B is a curl ![]() of vector potential A that occurs in Unit 2 Ch. 8.
of vector potential A that occurs in Unit 2 Ch. 8.
![]()
Index notation for the double-cross product is the following. Note e-symmetry gives:![]()
![]()
Here the dummy-index-convention sums any indices repeated on one side of the equation such as i, j, a, and b above. Applying the Levi-Civita e-identity reduces the equation.
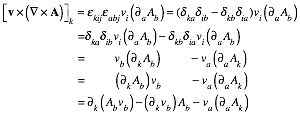
This is converted back to Gibbs’s bold vector notation that involves tensors like ![]() and
and ![]() .
.
![]()
Again, tensor index notation helps to distinguish ![]() ,
,![]() , and
, and ![]() .
.


![]()
However, in Newtonian mechanics the position ![]() and velocity
and velocity ![]() have no explicit dependence and so all r-partial derivative of v (or vice-versa) are identically zero.
have no explicit dependence and so all r-partial derivative of v (or vice-versa) are identically zero.
![]()
Then the double-cross product reduces as follows.
![]()
Try using e-identities to reduce ![]() ,
, ![]() ,
, ![]() , and
, and ![]() .
.
Exercise 1.2.1 Redraw Fig. 2.5 for initial speeds (VSUV=40,VVW=10) with the SUV only twice the mass of the VW. (Hummer-Lite) Include also a line describing the frame in which the SUV is initially stationary and another for which the SUV is finally stationary.
Solution 2.2.1 Intercepts of 45° lines with v1 or v2 axes indicate the IN or FIN frames for VW or SUV.
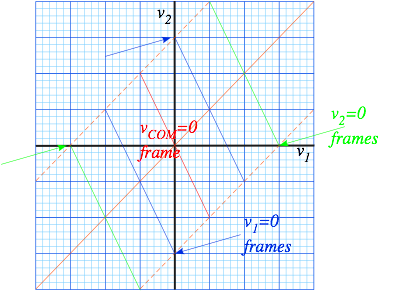
Exercise 1.2.2 This is a dimensional analysis and power law problem. It involves Olympic weight lifters but is a general piece of mechanics that applies to everything. (Have you wondered why toy cars can fall off cliffs without damage while yours cannot?)
Olympic weight lifters are divided into several classes according to their body weight. Generally the best performers are close to the maximum allowed for their class in all but the largest "open" classes.
(a) From dimensional arguments alone, you can predict that the Olympic records R in a given event (say, the "clean and jerk" which is always the greatest record) should have a definite functional relationship to the weight W=Mg of the performers: R= R(W). Derive R(W) as a power law times an undetermined coefficient.
(b) Obtain a set of records from an almanac or book of records, and plot them against W for a given event or events. See how well your theory and experiment jive. (Hint: It is most convenient to plot on log-log graph paper. Why?)
(c) Use the results of (a) and (b) to answer: How many times his bodyweight could a man lift if he was the size of an ant with a mass of M = 1 gm.? (A real ant is supposed to lift five or ten times its body weight. How much better or worse is the ant doing than "Antman"? )
Solution 1.2.2
Strength is proportional to crossection-area : S=kSA= kSL2.
Weight is proportional to volume : W=kWV= kWL3.
Strength is proportional to cross-section-area : S= kSL2= kS[(W/kW)1/3]2= (kS/kW1/3) W2/3.
If dimensional theory was correct then log-log graph would give straight line of slope 2/3:
log S=log (kS/kW1/3)+(2/3)log W.
If W=125kg man could lift S=400kg (that’s pushing it!) then: S=400= (kS/kW1/3) 1252/3= (kS/kW1/3)25.
This gives a coefficient of : (kS/kW1/3)=8. (That would be 3.2 times weight.)
Given the same structure, a W=1kg man could lift S=8kg. (8 times weight.)
A W=10-3kg=1gm “ant” man could lift S=8·10-2kg=80gm. (80 times weight.)
A W=10+3kg “Elephant” man could lift S=8·102kg=800kg. (0.8 times weight.)
A W=10+6kg “KingKong” man could lift S=8·104kg=80,000kg. (only 8% of weight.)
Exercise 1.3.1
Don’t look at figure below until you try the exercise yourself first.!
Plot a (VSUV-1,VSUV-2)=(60,10) collision like Fig. 3.1 but with an identical M=4 SUV replacing the VW.
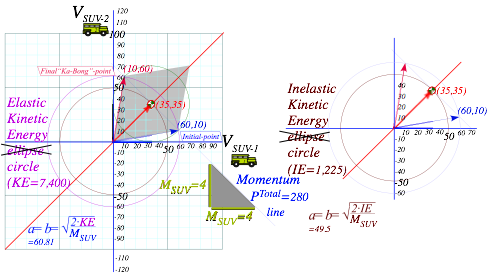
Exercise Fig. 3.3 Equal mass M=4 SUV collision geometry for elastic and inelastic cases.
Exercise 1.3.2. Quick construction of Energy ellipses
Graph paper facilitates construction of energy ellipses given the two radii a and b in (3.7). The first step is to draw concentric circles of radius a and b. Then any radial line OBA “points” to a point E on the ellipse.
Ellipse point E lies at the intersection of a vertical line AE thru radial intersection A with circle a and a horizontal line BE thru radial intersection B with circle b.
Graph grid “finds” E for a radius OBA, no need to draw AE or BE. You can pick x and find y or vice-versa.
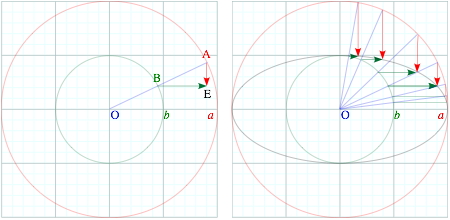
Exercise Fig. 3.4 Ellipse construction
Ellipse coordinates (xE=a·cos σ, yE=b·sin s) are rescaled base and altitude (xr=r·cos s, yr=r·sin s) of Fig. 1.4.
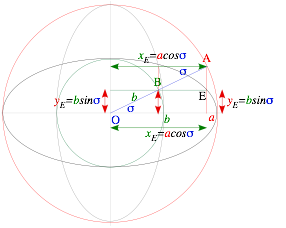
Exercise Fig. 3.5 Analytic ellipse geometry
Verify that the values (x =a·cos s, y =b·sin σ) satisfy an ellipse equation (3.7b).
A dual or complimentary (gray) ellipse results if compliment angle sc=p/2-s is used so x and y values switch.
Exercise 1.4.1: Construct a history of a 4:1 mass ratio bounce. x1(0)=1.5, x2(0)=3.0, v1(0)=-1, v2(0)=-1
Ceiling height=7.0.(For bottom row: Ceiling height=6.0 ) The 4:1 mass ratio case is surprisingly periodic.
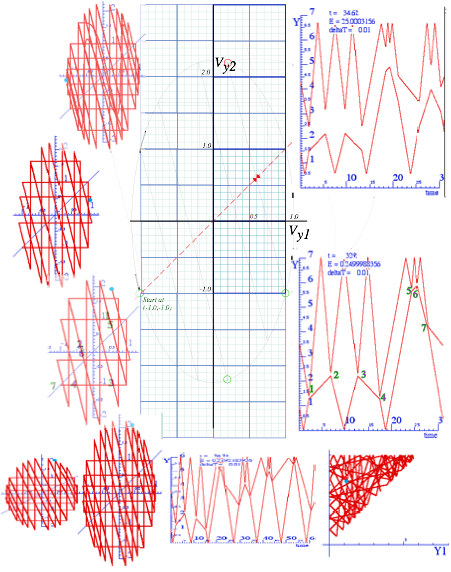
Exercise 1.4.2: Complete Fig. 4.12 two more steps. Ceiling height=3.0.
Where would “gameover” point be if floor was open after Bang-1?.
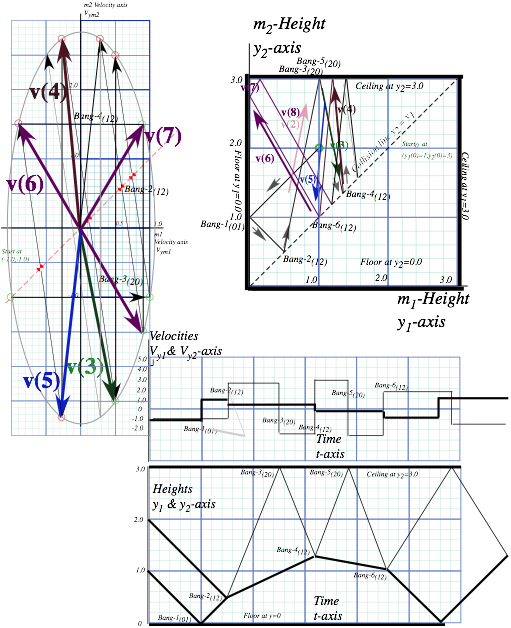
Exercise 1.5.1 Complete Fig. 5.1 to the game-over point where sequence ends without 2nd floor bounce.
What mass-ratio close to that of Fig. 5.1 would cause the two to drop away with equal final velocity.
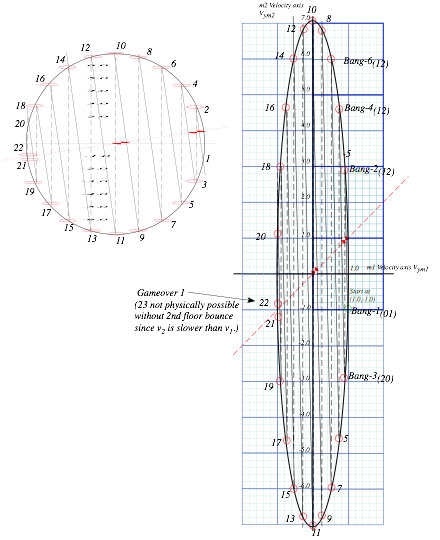
For high mass ratio m1/m2=49 it takes 10 collisions to convert (v1,v2)=(1,-1) to (v1,v2)=(-0.997,+1.14).
…and it takes 11 collisions to convert (v1,v2)=(1,-1) to (v1,v2)=(-1.0026,+0.8608).
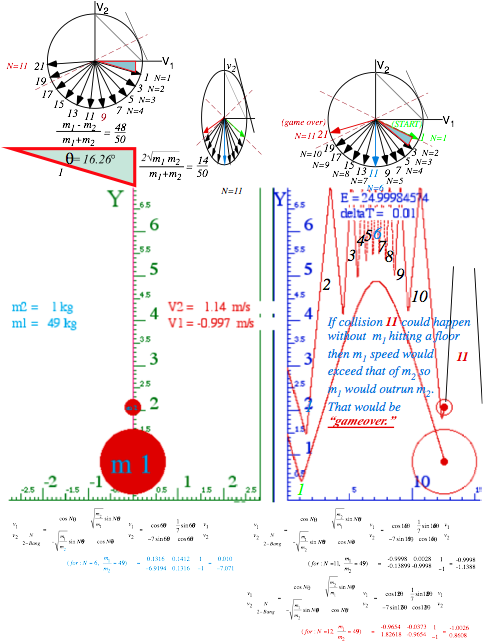
Exercise 1.5.2. Ch. 1-5 contains geometric description of 1D-2-body collisions. Most examples originate from initial velocity vectors ![]() for which m1 and m2 have equal speeds (in this case unit speed).
for which m1 and m2 have equal speeds (in this case unit speed).
This exercise is intended to help match algebra and geometry by asking for the simplest formulas for the various velocities in a figure below that are final elastic results of the following initial velocity vectors.
a. ![]() b.
b. ![]() c.
c. ![]() d.
d. ![]()
Derive the IN and FIN components of all vectors in terms of masses m1 and m2 only assuming the same total KE as ![]() has. (Check your results against figure in which ratio 2=m1/m2 holds.)
has. (Check your results against figure in which ratio 2=m1/m2 holds.)
Indicate where the time reversed vector T·VIN of each VIN lies.
Give a formula for the orange (dashed) and green (solid) tangent line slopes in terms of m1 and m2.
…and compare to slope of the black line connecting major and minor radii in terms of m1 and m2.
Solution 1.5.2.
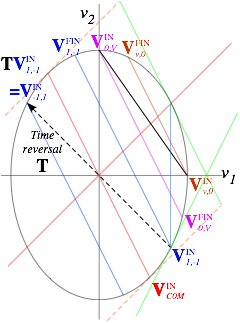
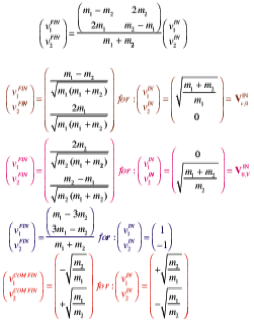
KE determined by ![]() =(1,-1) is :
=(1,-1) is :![]() .
.
All others on the KE-ellipse have same KE so: ![]() and:
and: ![]() .
.
Lines with positive slope are slope=+1. That includes the dashed tangents to ellipse at ![]() .
.
(That is due to Galileo’s translation symmetry.)
Lines with negative slope are slope=-m1/m2 except for the black line that has slope=-![]() =-v/V.
=-v/V.
(That is due to Galileo-Newton momentum conservation.) (In this graph the mass ratio is m1/m2=2.)
The COM collision frame starts with ![]() and has the same KE and slope -m1/m2 , too.
and has the same KE and slope -m1/m2 , too.

![]() So:
So: ![]() .
.
General vFIN related to vIN by vFIN=2VCOM-vIN or:  . This gives the v’s.

Below are details of dipole function geometry in Fig. 10.11 and the Lorentzian geometry discussed in Unit 4.
